Pound on the rebound
GBP/USD (daily chart shown below) has rebounded back up to around the 1.6750 resistance area after having pulled back to a low of 1.6458 two […]
GBP/USD (daily chart shown below) has rebounded back up to around the 1.6750 resistance area after having pulled back to a low of 1.6458 two […]
GBP/USD (daily chart shown below) has rebounded back up to around the 1.6750 resistance area after having pulled back to a low of 1.6458 two weeks ago. That pullback represented a measured 61.8% Fibonacci retracement of the last major bullish run, which ran from early February’s 1.6250 low up to mid-February’s four-year high at 1.6821.
Tuesday’s aggressive advance has once again pushed the currency pair back up above both its 50-day moving average as well as a major bullish trend line that extends back to the 1.4800-area double-bottom low in July of 2013.
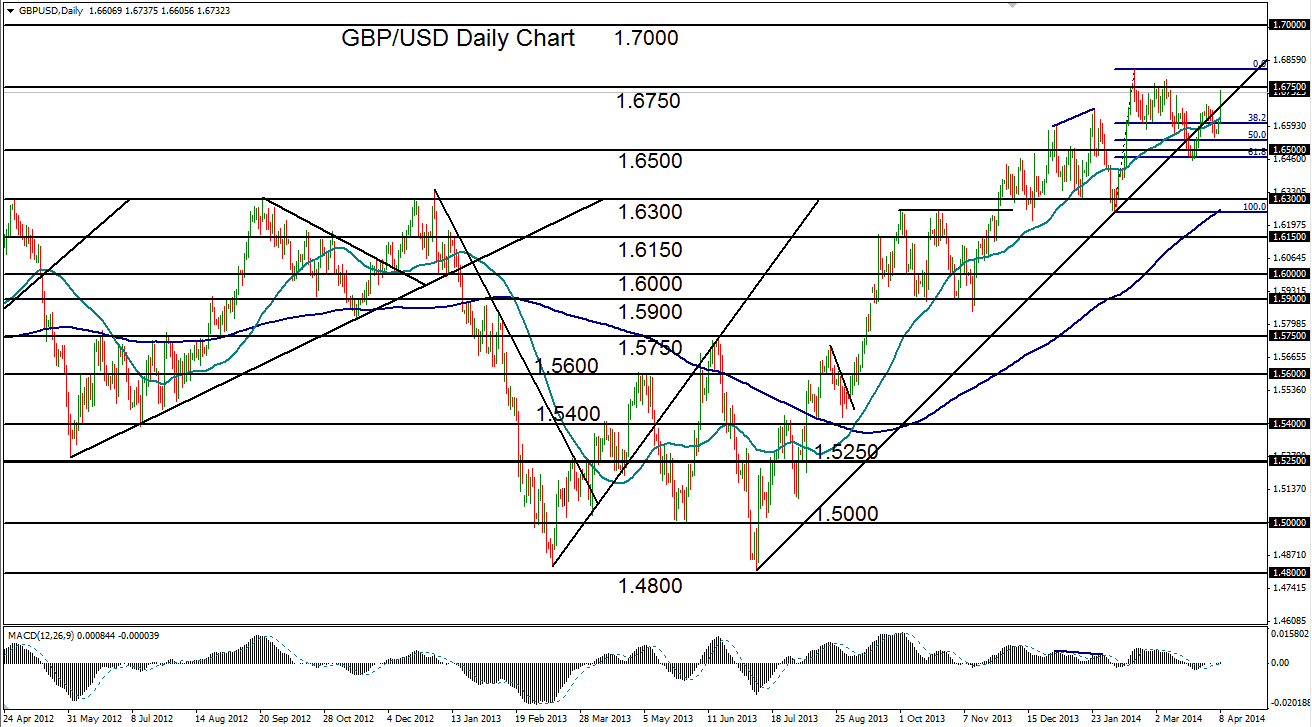
Currently, the pair is close to approaching a potential challenge of February’s long-term high. Any breakout above the current resistance area and then the noted 1.6821 four-year high would confirm a continuation of the strong bullish trend that has been in place for the past nine months.
In the event of this breakout, the major upside target within long uncharted territory resides around the 1.7000 psychological level, which is also around a high extreme reached in mid-2009.
Key downside support currently continues to reside around the 1.6500 area.
