


December 3, 2020 1:29 PM
Potential for more stimulus tanks the US Dollar: DXY, EUR/USD, GBP/USD, USD/CAD
With the dovish ex-Fed Chairman Janet Yellen in as the Treasury Secretary for Joe Biden and Jerome Powell as the current Fed Chairman, markets are anticipating more stimulus, and the US Dollar is getting pummeled. Yesterday, a bipartisan stimulus plan of roughly $908 Billion was constructed by the House and sent to the Senate. Senate Majority Leader McConnell said that the President would never sign it, so it will just sit there. However, that’s not to say that nothing will get done! Joe Biden backed this deal, saying that it’s a start as it would provide immediate assistance. Markets took this as a sign that more stimulus was on the way and crushed the US Dollar!
DXY
On a weekly timeframe, the DXY has broken through two horizontal levels of support this week near 91.75 and 90.93. It is now trading in a band of support from 88.94 to 90.93. The RSI is diverging with price, indicating that there is potential for a bounce in the US Dollar.
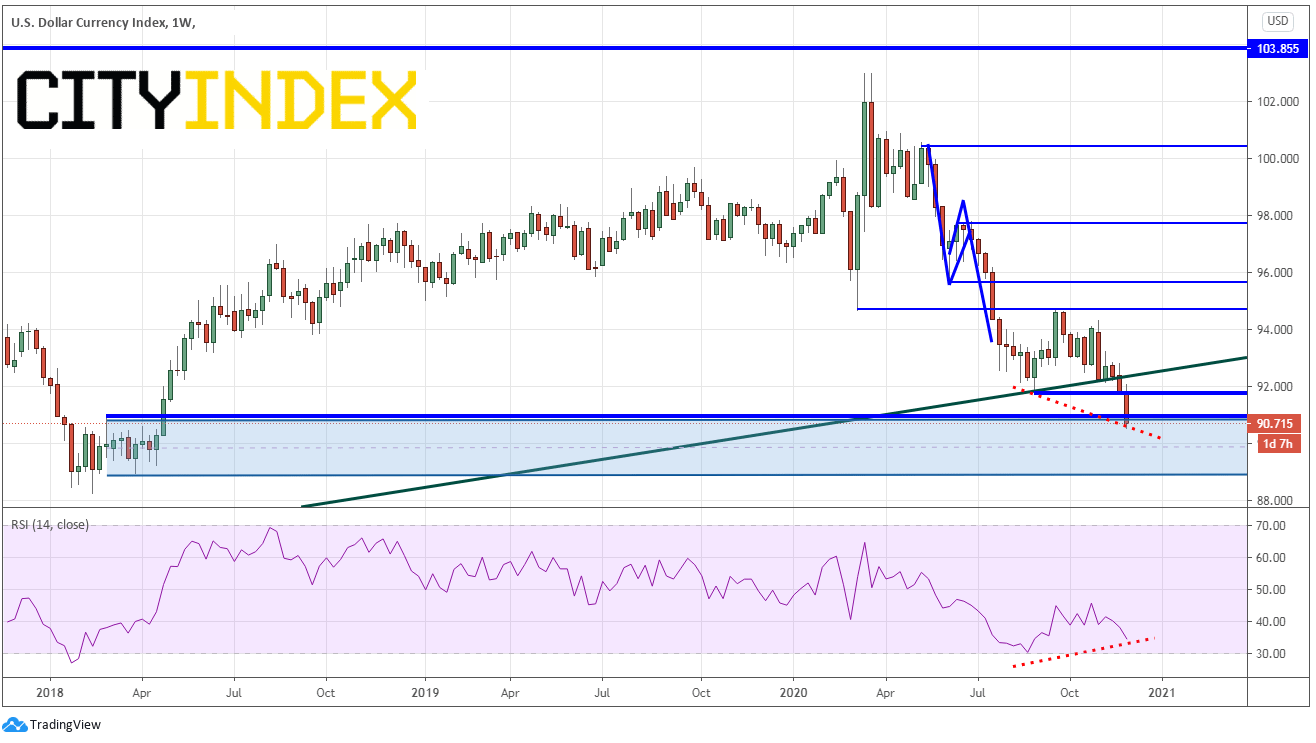
Source: Tradingview, City Index
What does that mean for other US Dollar pairs?
EUR/USD
On a daily timeframe, EUR/USD is breaking into new high territory. Earlier in the week, the pair took out the September 1st highs, just above 1.2000. Today, the EUR/USD took out the 127.2% Fibonacci retracement level from the highs of September 1st to the November 4th lows, near 1.2122. In addition, the pair took out the 78.6% Fibonacci retracement level from the highs on January 2018 to the lows of March 23rd. In addition to taking out the 1.2000 level, the pair also broke out of a double bottom formation. The target for a double bottom is the height of the pattern added to the breakout point, which puts it near 1.2425. However, with the RSI near 75.00, buyers will be looking for any dip towards yesterdays highs at 1.2100 to try and add to longs.
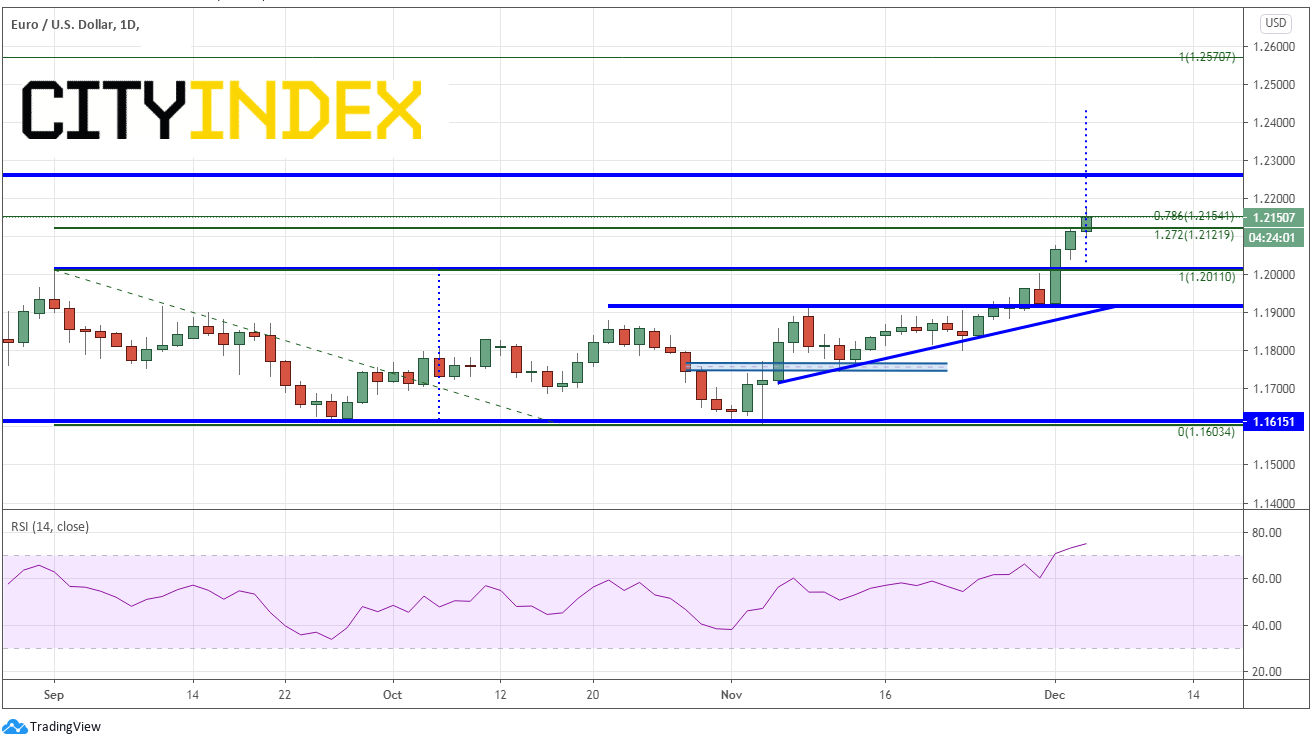
Source: Tradingview, City Index
GBP/USD
Price movement in the Pound lately has been primarily driven by Brexit. However, today’s move higher in GBP has been driven by the weakness in the US Dollar. GBP/USD recently broke above a 13-year downward sloping trendline (red line). Today, the pair broke above upward sloping channel resistance as well as the highs from September 1st, near 1.3483. Buyers will be waiting to enter long positions back at the 13-year trendline near 1.3300. Horizontal support sits below at 1.3175 and they bottom channel trendline near 1.3075.
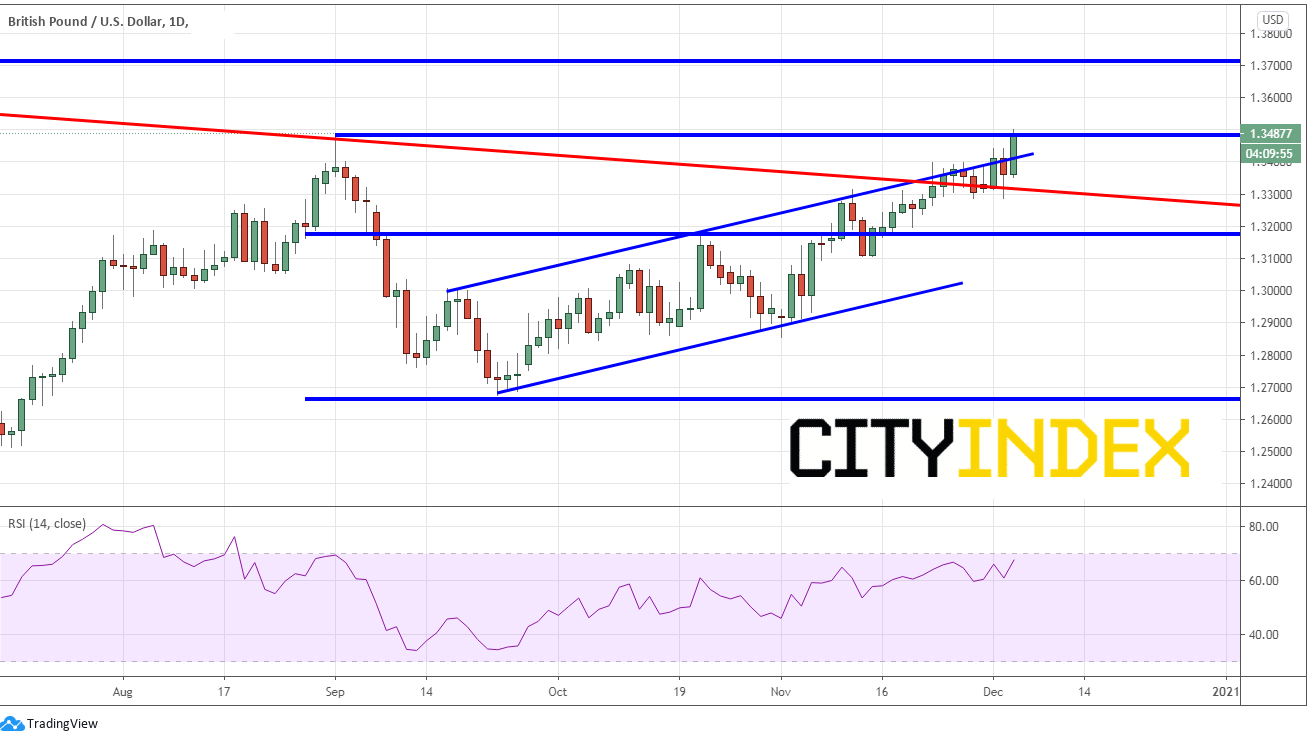
Source: Tradingview, City Index
USD/CAD
USD/CAD has been driven lately, in part, by the price of oil. As Canada is an oil exporting country, the higher the price of oil goes, the higher the Canadian Dollar goes (lower USD/CAD). However, today the price of USD/CAD appears to be driven more by the US Dollar. On November 13th, price failed to hold above the upward sloping trendline from September 1st near 1.3200 and formed an evening star candlestick formation, which is a reversal pattern. Price has been moving since. Earlier in the week, price broke previous lows and horizontal support near 1.2980. In doing so, USD/CAD broker lower from a sideways channel pattern. The target for the breakdown from the channel is near 1.2600. Sellers will be sitting near the previous resistance at 1.2980 looking to add to shorts. First support is just below current levels at the 127.2% Fibonacci extension from the September 1st lows to the September 29th highs, near 1.2860. The 161.8% Fibonacci extension from the same timeframe is 1.2707.
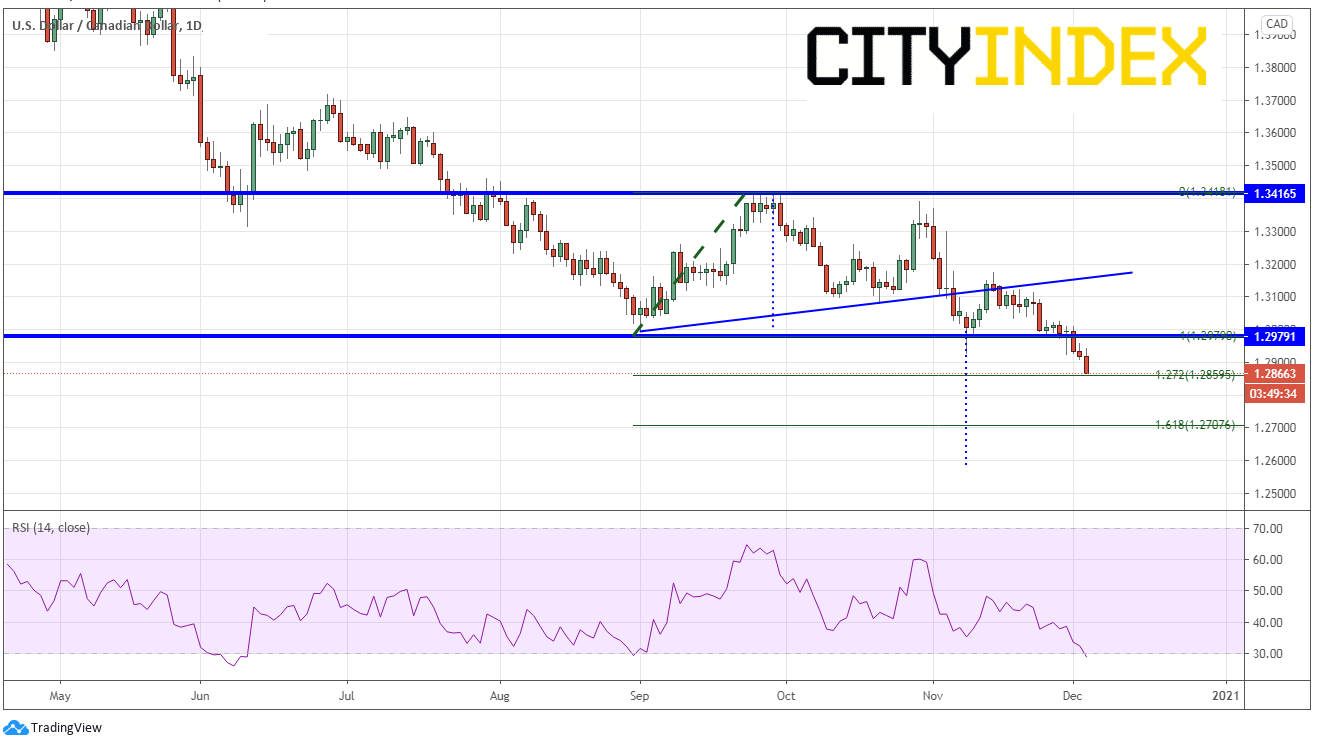
Source: Tradingview, City Index
Help is on the way in the form of US stimulus, and as a result, the US Dollar has been taking a beating. Watch the US Dollar counter-currency pairs. Traders will be looking to take advantage of USD bounces to add to short positions!
Latest market news
Yesterday 01:23 PM
Yesterday 06:01 AM
April 18, 2024 11:27 PM
Latest DXY articles
April 10, 2024 11:24 PM
April 8, 2024 03:35 AM
April 4, 2024 10:28 PM
April 3, 2024 02:35 AM