


Pattern play: Veeva Systems
Veeva Systems (VEEV), a supplier of vertical software solutions, broke out to the upside of an intermediate-term falling wedge pattern that began to form in late-October. The RSI is just above 50. The simple moving averages (SMAs) are arranged in a mixed to bullish manner, with the 50-day SMA above the 20-day SMA and the 20-day SMA above the 200-day SMA. If the 20-day SMA crosses to the upside of the 50-day SMA, it would be a bullish signal. If price can manage to hold above the upper trendline of the falling wedge pattern then price will likely advance towards 295.00. If price can get above 295.00 it would probably try to retest the record high of 314.00. If price can break through 314.00, it could potentially continue to run. On the other hand, if price falls below the upper trendline of the pattern, then traders should look to 257.00 for support. If price fails to hold at 257.00, it would be a bearish signal that could hint at a drop back to 240.00.
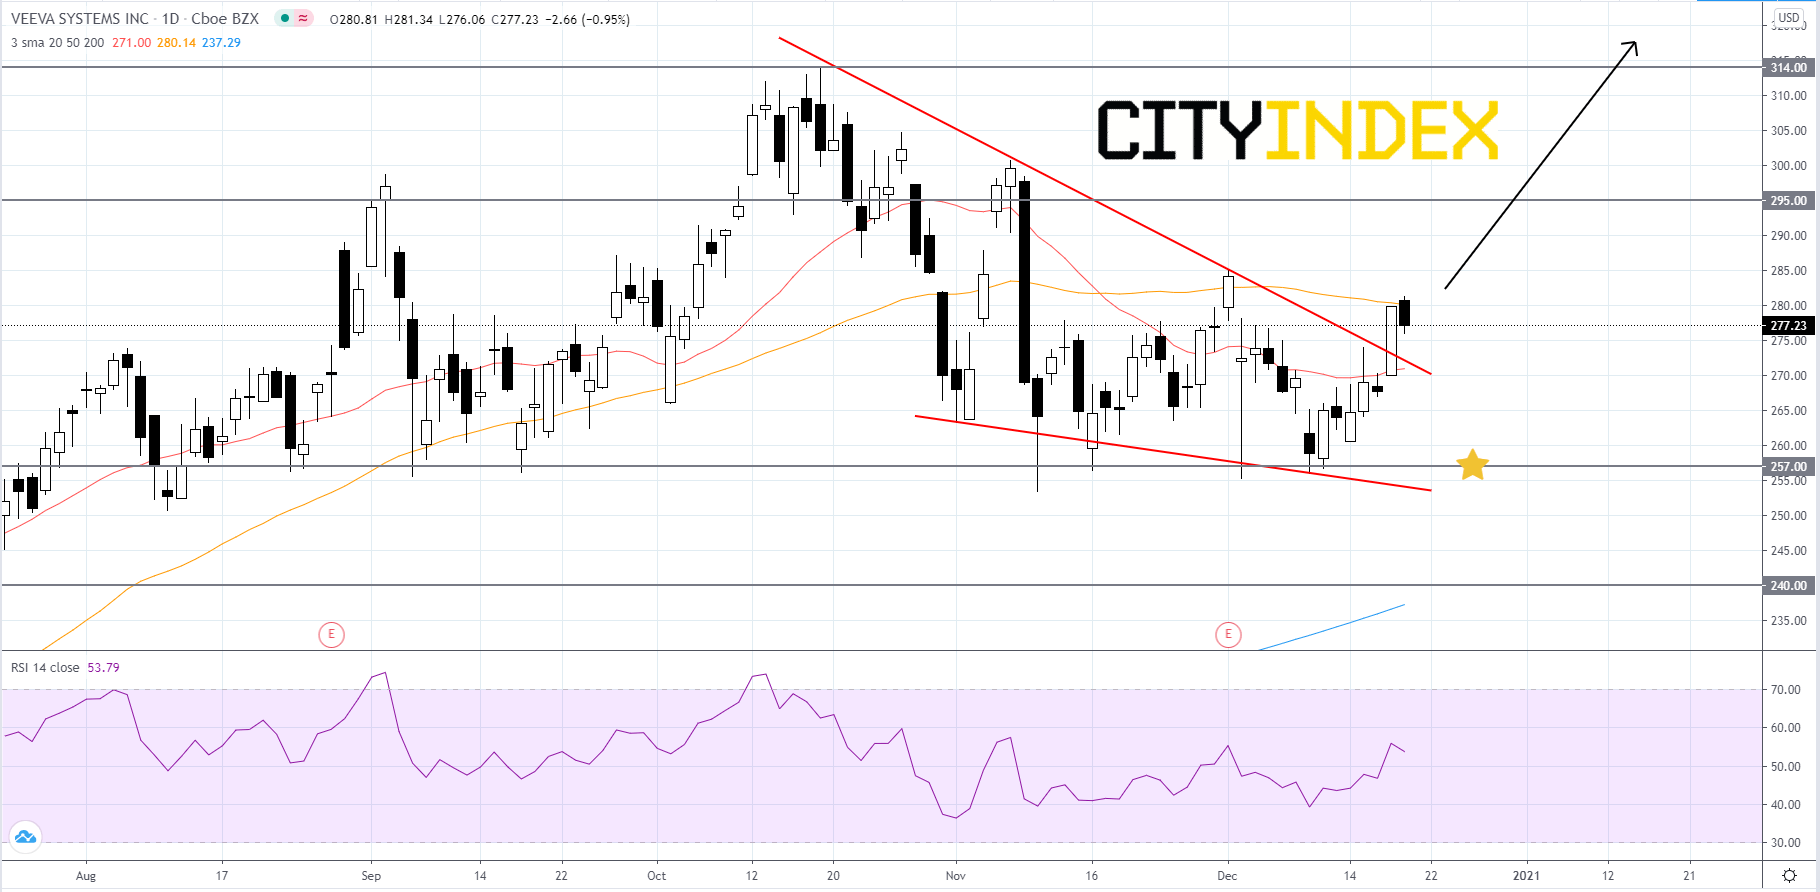
Source: GAIN Capital, TradingView
Source: GAIN Capital, TradingView
Latest market news
Today 11:14 AM
Today 08:28 AM
Yesterday 03:30 PM
Latest Tech Stocks articles
October 19, 2023 09:47 AM
October 18, 2023 12:06 PM
October 11, 2023 02:41 PM
October 3, 2023 12:24 PM