


Pattern play: Edwards Lifesciences
Edwards Lifesciences (EW), a designer and manufacturer of medical devices for heart disease, broke out to the upside of a descending broadening wedge pattern on December 22nd, after price held just below the upper trendline for a few weeks. The RSI is over 60 and appears to have broken out to the upside of a sideways channel. The simple moving averages (SMAs) are arranged in a bullish manner, as the 20-day SMA is above the 50-day SMA and the 50-day SMA is above the 200-day SMA. The next Fibonacci resistance levels are at 97.50 and 102.75. If price slips then traders should look to the upper trendline for support, as it recently acted as a strong resistance level. If price drops below the upper trendline of the pattern then 83.00 and 78.50 would be the immediate support levels.
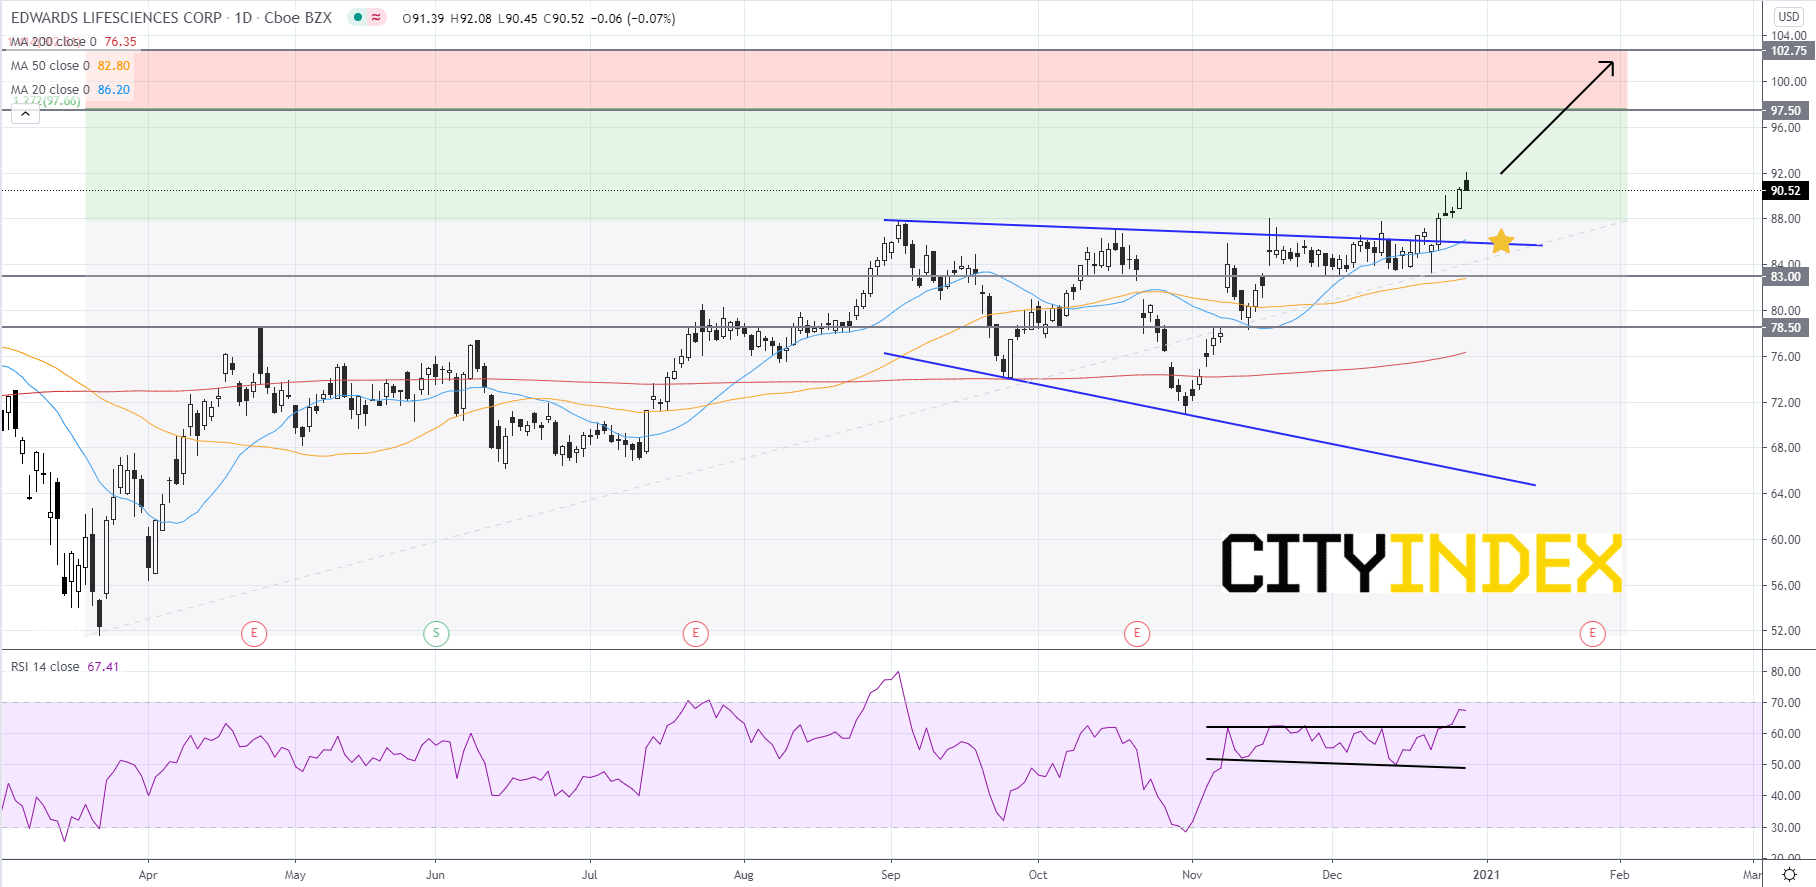
Source: GAIN Capital, TradingView
Source: GAIN Capital, TradingView
Latest market news
Yesterday 08:33 AM
Latest Stocks articles
April 17, 2024 11:00 AM
March 21, 2024 04:05 AM
March 7, 2024 05:03 AM
February 7, 2024 05:52 PM