


Pattern play: Berry Global Group
Berry Global Group (BERY), a manufacturer and seller of packaging products, broke out to the upside of a short-term bull flag pattern that began to form in late-October. The RSI has also just crossed to the upside of a bearish trendline that has been in place since mid-November. The simple moving averages (SMAs) are arranged in a bullish manner, with the 20-day SMA above the 50-day SMA and the 50-day SMA above the 200-day SMA. Price will likely grind towards the last peak of 58.00. If price can get above 58.00 then it will likely head for 61.00. If price slips, then traders should look to 52.50 for a potential bounce. If 52.50 fails to support price, it would be a bearish signal that could send price to 50.70. If price is not able to rebound off of 50.70, it would be another bearish signal as price would be below its 50-day SMA.
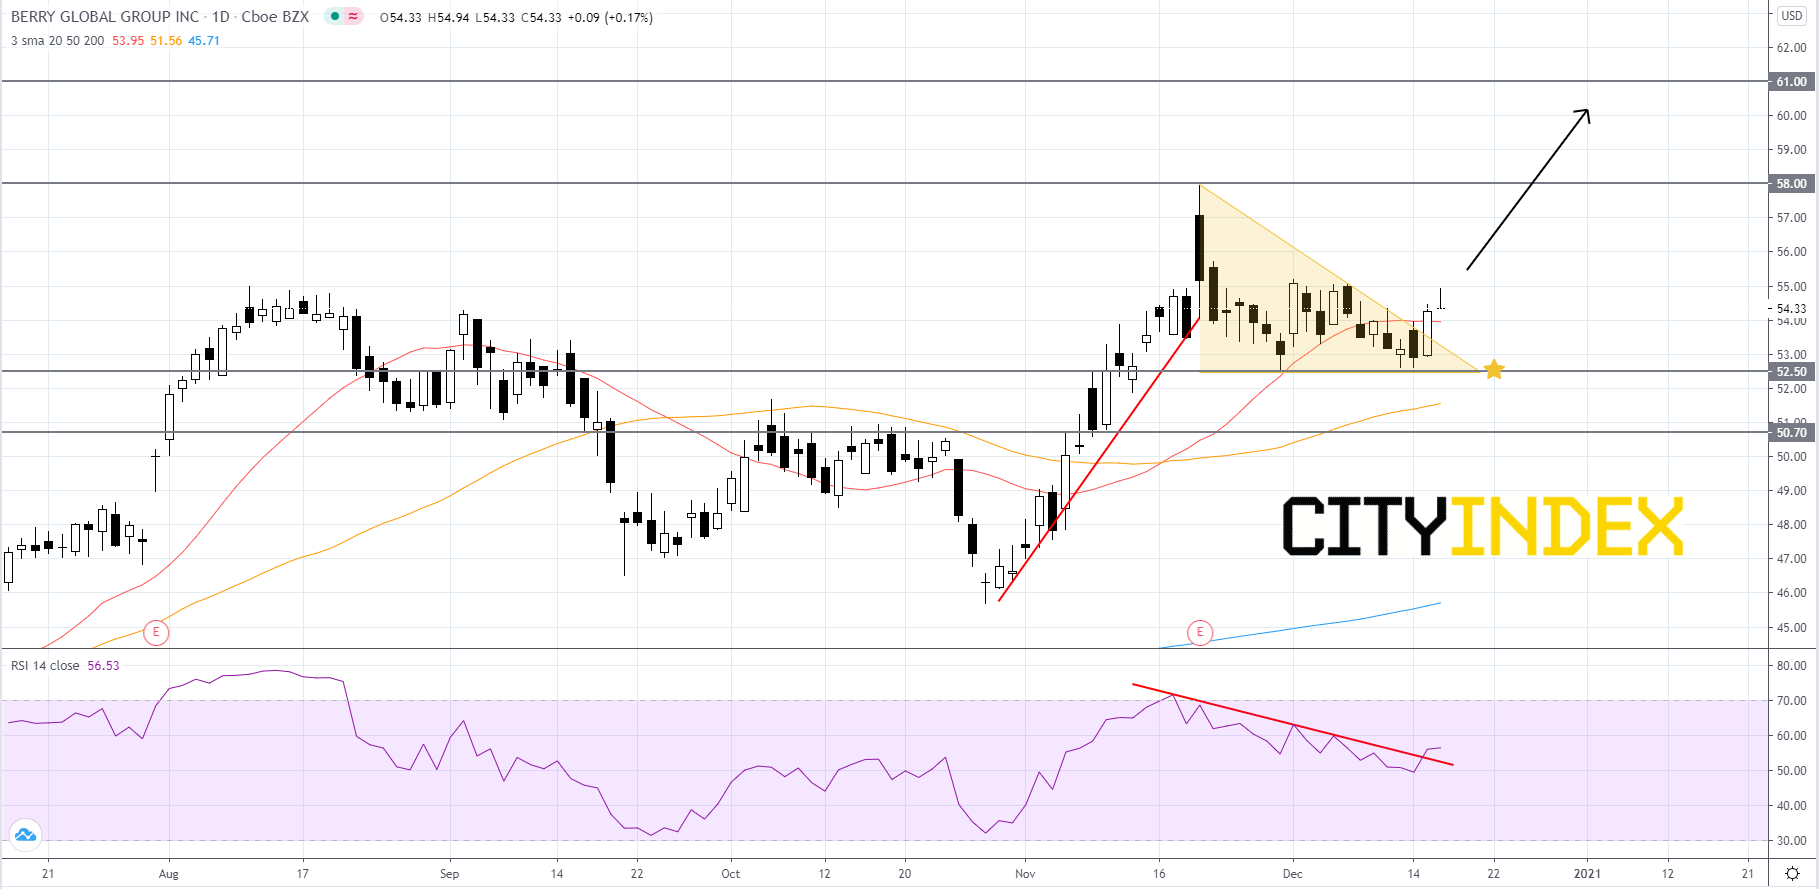
Source: GAIN Capital, TradingView
Source: GAIN Capital, TradingView
Latest market news
Yesterday 01:23 PM
Yesterday 06:01 AM
April 18, 2024 11:27 PM
April 18, 2024 04:46 PM
Latest Stocks articles
April 17, 2024 11:00 AM
March 21, 2024 04:05 AM
March 7, 2024 05:03 AM
February 7, 2024 05:52 PM