
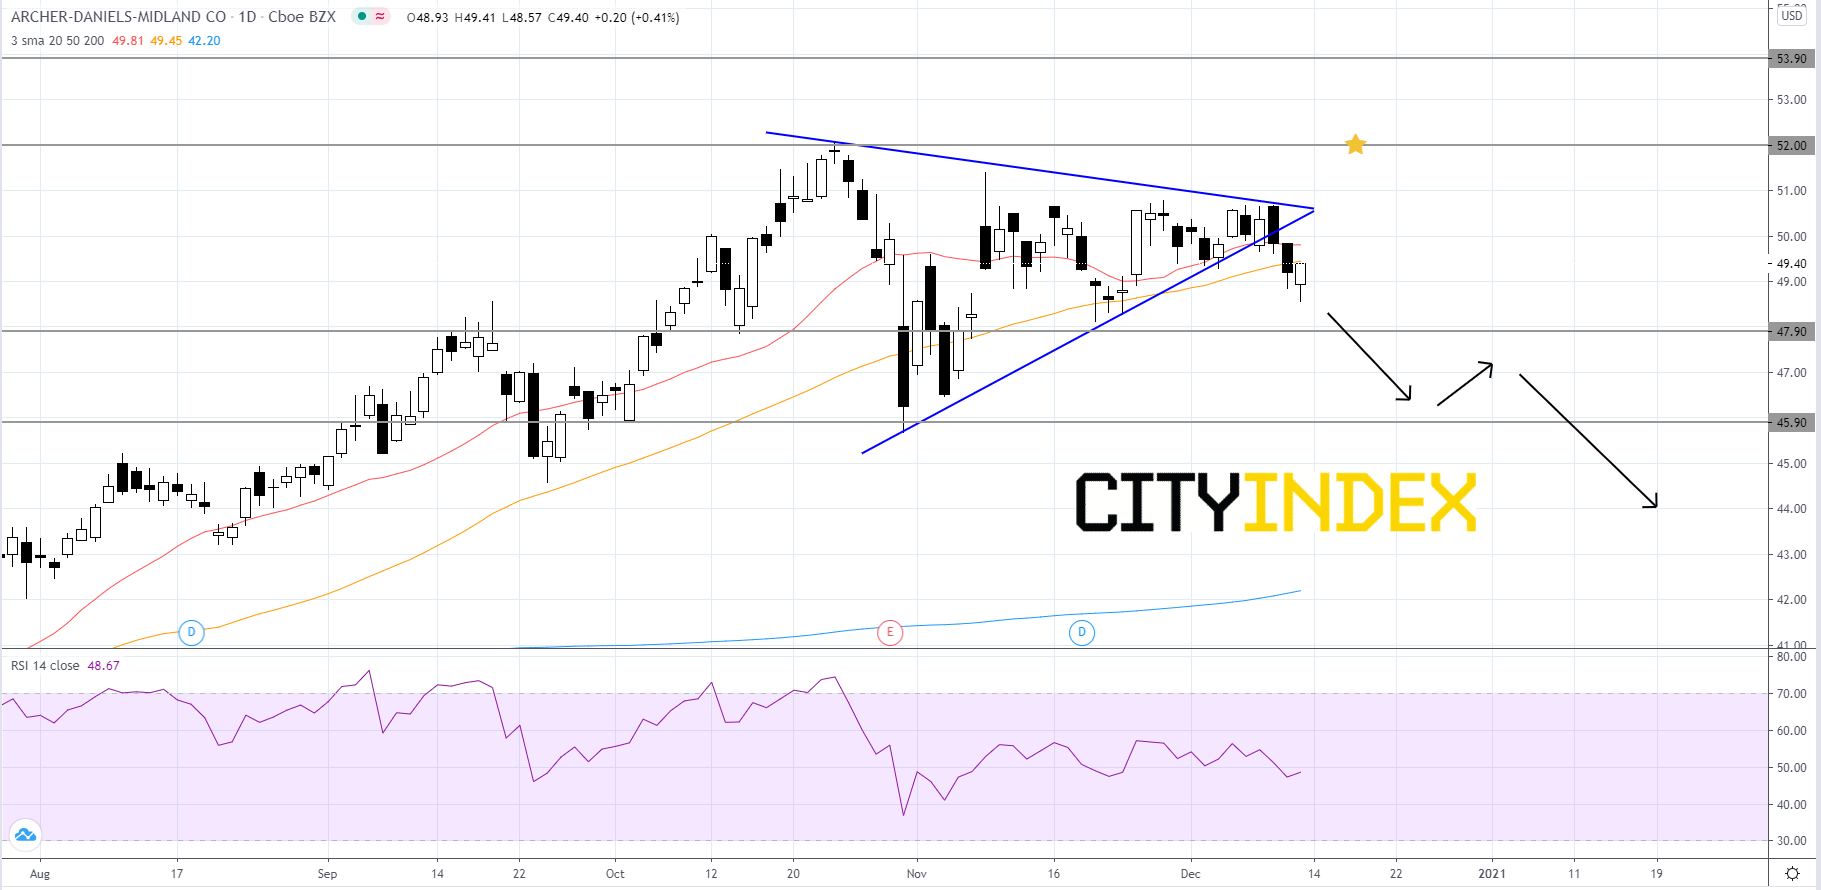
Pattern play: Archer-Daniels-Midland
Archer-Daniels-Midland (ADM), a global processor of agricultural commodities, broke out to the downside of a short-term symmetrical triangle pattern that began to form after price made its 2020 high of about 52.00 in late-October. The RSI has been holding around its neutrality area of 50. The simple moving averages (SMAs) are arranged in a bullish manner, with the 20-day SMA above the 50-day SMA and the 50-day SMA above the 200-day SMA. If the 20-day SMA crosses below the 50-day SMA, it would be a bearish signal. Interestingly, ADM's last peak was also at roughly 52.00 and occurred in October of 2018. Given the weak RSI reading and the downside pattern breakout, price will likely retreat towards the 47.90 support level. Price will likely break below 47.90 and dip to 45.90. If price manages to get under 45.90 then price could tumble further. On the other hand, if price can get above its 2020 high of 52.00 then price could aim to retest the all time high of 53.90. If price gets above 53.90, it could continue to run.
Source: GAIN Capital, TradingView
Source: GAIN Capital, TradingView
Latest market news
April 25, 2024 03:09 PM
April 25, 2024 03:00 PM
April 25, 2024 01:12 PM
April 25, 2024 11:14 AM
Latest Stocks articles

April 17, 2024 11:00 AM

March 21, 2024 04:05 AM

March 7, 2024 05:03 AM

February 7, 2024 05:52 PM