


Pattern play: Advanced Micro Devices
Advanced Micro Devices (AMD), a designer and producer of microprocessors, jumped to a record high after the company's stock price broke out to the upside of a short-term bull flag pattern that began to form at the beginning of November. The RSI is over 60 and showing bullish momentum. The simple moving averages (SMAs) are arranged in a bullish manner, with the 20-day SMA above the 50-day SMA and the 50-day SMA above the 200-day SMA. Price will likely advance towards the first Fibonacci target of 104.00. If price can breakout above 104.00 then its next Fibonacci target would be 109.00. If price surpasses 109.00 it will likely continue to run. On the other hand, if price retreats then traders should look to 94.25 for support. If 94.25 fails to hold price up then 89.00 would be the last line of defense. If price gets below 89.00 it would be a bearish signal, as price would be below its 20-day SMA and could slip to 82.25.
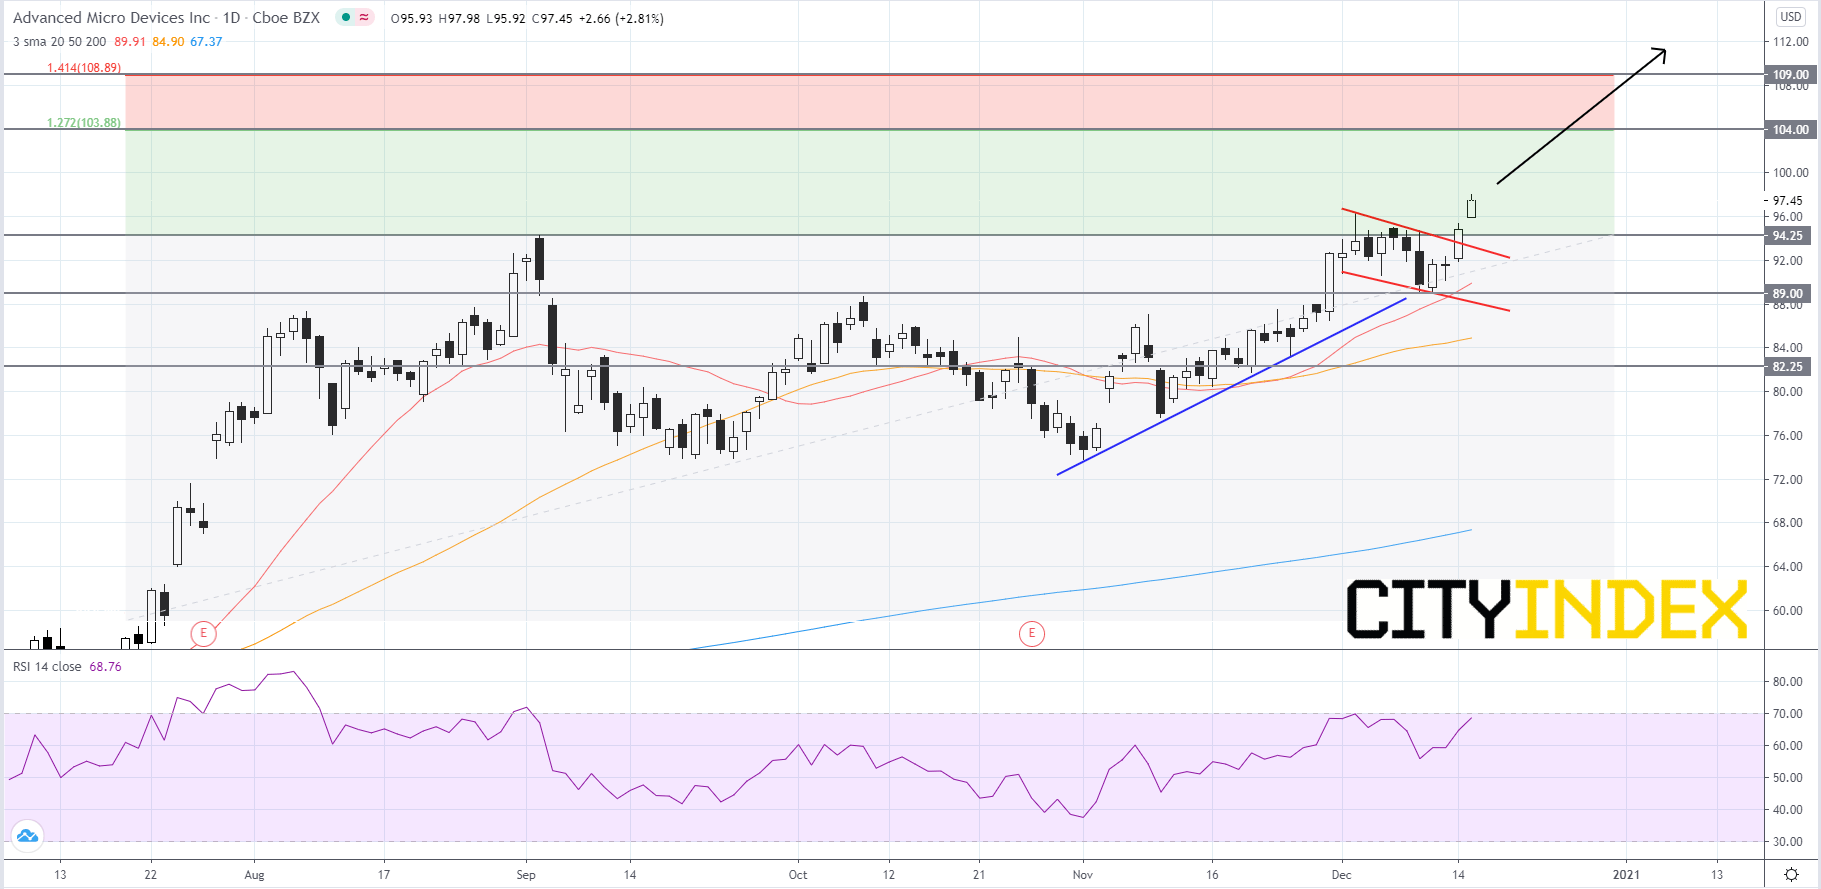
Source: GAIN Capital, TradingView
Source: GAIN Capital, TradingView
Latest market news
Yesterday 03:30 PM
Yesterday 01:23 PM
Yesterday 11:00 AM
Yesterday 08:15 AM
Latest Tech Stocks articles
October 19, 2023 09:47 AM
October 18, 2023 12:06 PM
October 11, 2023 02:41 PM
October 3, 2023 12:24 PM