


One of this Mornings Biggest Losers: Halliburton
On Thursday, Halliburton (HAL), an oil and gas services company gapped down over 12% at the opening bell.
From a chartist's point of view, on a daily chart, Halliburton's stock price has been rising inside of an ascending channel that started in mid-March. On Friday, June 5th, price broke to the upside of the channel and managed to hold above the upper trend line until this morning. The RSI is currently headed back down towards 50 after falling from overbought territory. Price is expected to slip a little lower before bouncing off the lower trend line around the $11.00 support level, maintaining the channel. Price would then have support to make its way back up to retest the $16.50 level before continuing to $18.50. If price cannot hold up the lower trend line around the $11.00 support, then price might decline towards the $9.00 support and possibly lower.
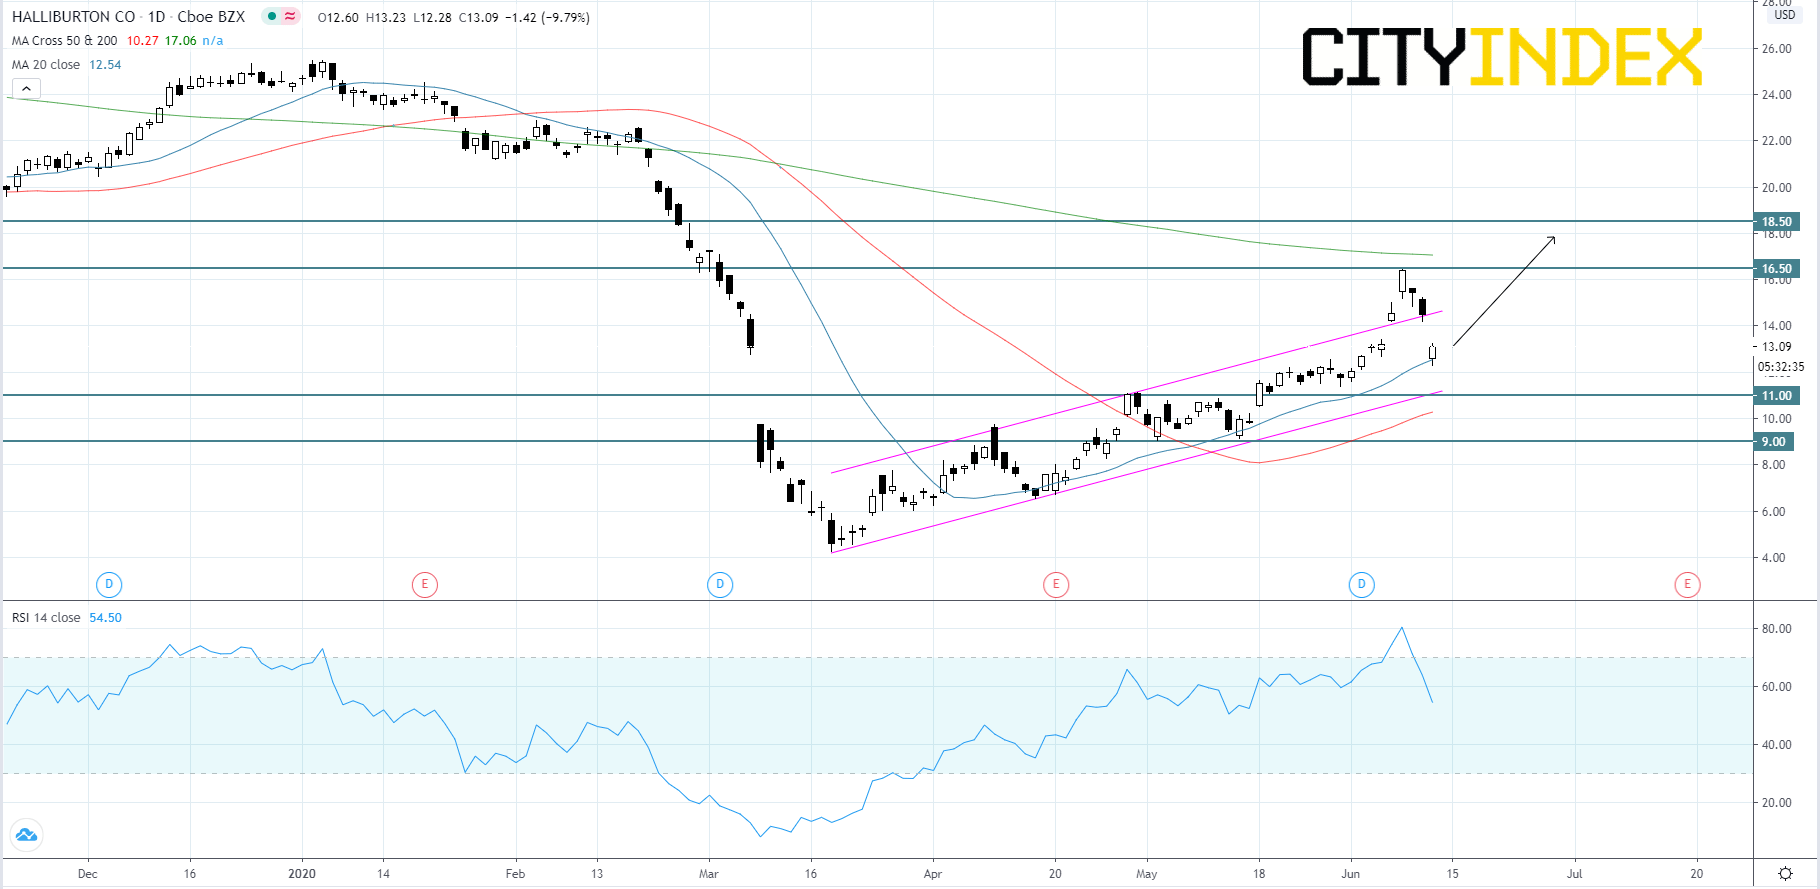
Source: GAIN Capital, TradingView
Looking at a weekly chart, Halliburton's stock price has been falling within a descending channel that has been in place since mid-May of 2018. Price is approaching a critical point inside of this channel, the upper trend line. If price advances to the upper trend line and is rejected, then we should expect price to fall in the intermediate-term. But if price is able to break through the upper trend line, it could be the start of an up trend.
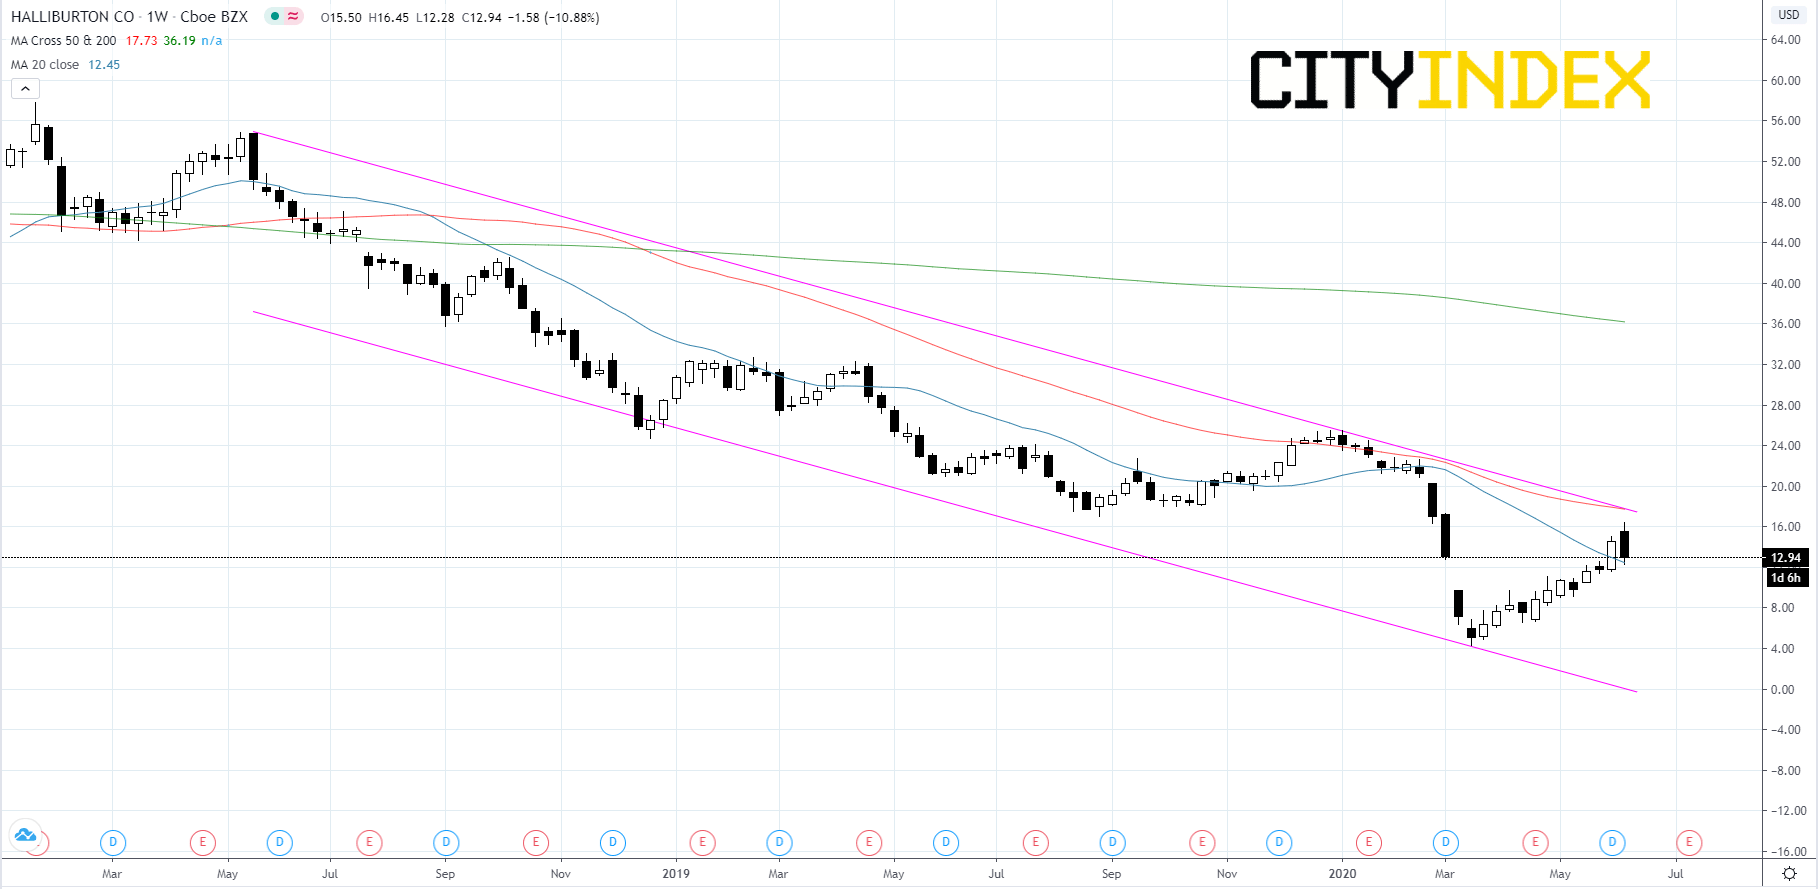
Source: GAIN Capital, TradingView
From a chartist's point of view, on a daily chart, Halliburton's stock price has been rising inside of an ascending channel that started in mid-March. On Friday, June 5th, price broke to the upside of the channel and managed to hold above the upper trend line until this morning. The RSI is currently headed back down towards 50 after falling from overbought territory. Price is expected to slip a little lower before bouncing off the lower trend line around the $11.00 support level, maintaining the channel. Price would then have support to make its way back up to retest the $16.50 level before continuing to $18.50. If price cannot hold up the lower trend line around the $11.00 support, then price might decline towards the $9.00 support and possibly lower.
Source: GAIN Capital, TradingView
Looking at a weekly chart, Halliburton's stock price has been falling within a descending channel that has been in place since mid-May of 2018. Price is approaching a critical point inside of this channel, the upper trend line. If price advances to the upper trend line and is rejected, then we should expect price to fall in the intermediate-term. But if price is able to break through the upper trend line, it could be the start of an up trend.
Source: GAIN Capital, TradingView
Latest market news
Today 08:28 AM
Yesterday 03:30 PM
Yesterday 01:23 PM
Yesterday 11:00 AM
Yesterday 08:15 AM
Latest Equities articles
April 12, 2024 02:28 AM
April 7, 2024 08:46 PM
March 31, 2024 11:22 AM
