


April 5, 2021 4:37 PM
Oil prices flowing lower
Today is April 5th, the first full day the oil markets have been open since OPEC+ announced on April 1st that they would gradually increase production by 2 million barrels per day. They will increase 350,000 bpd May and June and 450,000 bpd thereafter. US oil markets moved higher on April 1st and were closed on Friday. UK markets were closed on Friday and today (however Brent is trading in light volume). In addition, the US showed large builds last week, indicating that there was already plenty of supply to go around. With the coronavirus uncertain around the world, particularly in Europe, demand is expected to slow more than previously thought. As a result, oil prices are lower.
What factors move the price of oil?
USOIL had been moving higher since the pandemic lows in mid-April 2020. From November 2nd, 2020, it moved aggressively higher and nearly doubled in price. On November 8th, USOIL spiked above its 2020 high to 67.94, and pulled back to form a dark cloud cover candlestick pattern, which is a reversal pattern. Price broke lower a few days later and have since calmed. However, today USOIL is down nearly 4.5% and looking to test the lows of March 23rd, near 57.28.
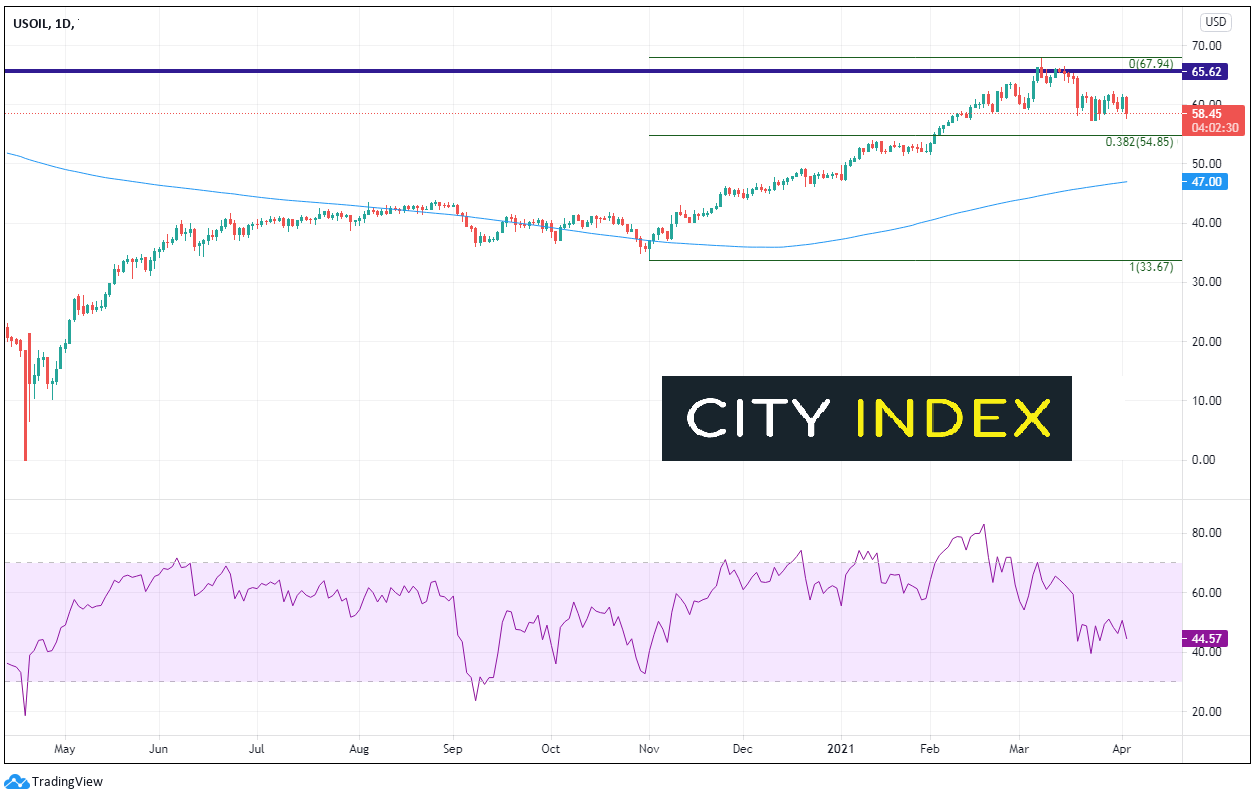
Source: Tradingview.com, City Index
On a 240-minute timeframe, USOIL broke lower below the bottom, rising trendline of a symmetrical trendline near 59.20. This is the first level of resistance. First support is the March 21st lows near 57.24. Next support is the 38.2% Fibonacci retracement from the November 2nd lows to the March 8th highs, near 54.85. The 200 Day Moving Average (see daily) sits at 47.00. In addition to the triangle resistance trendline mentioned above, the downward sloping trendline from the triangle crosses near 61.50 before a long-term trendline (green) dating back to November 9th, which crosses near 63.00.
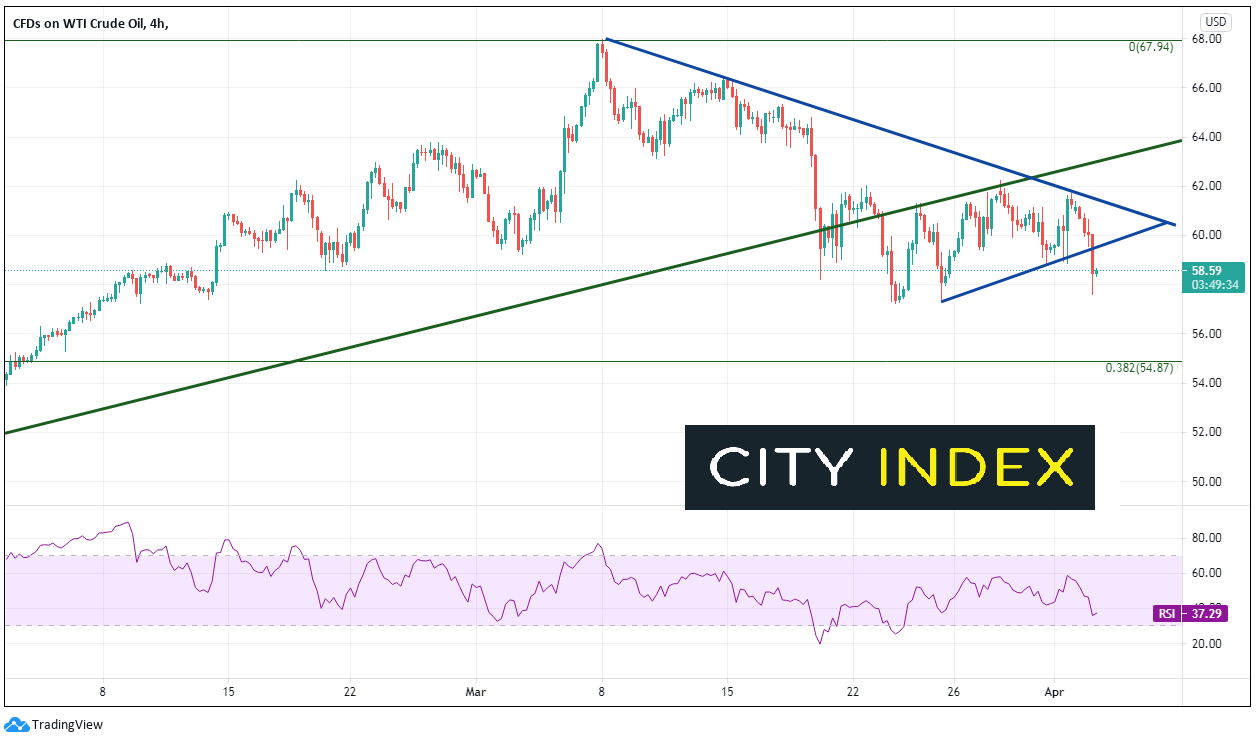
Source: Tradingview.com, City Index
As one may expect, UKOIL has almost identical price action as USOIL. Price nearly doubled from early November until March 8th, briefly taking out the highs from 2020 at 71.03 and trading as highs as 71.11. From there UKOIL also pulled back, forming a dark cloud cover. Price broke lower a few days later. However today UKOIL is down nearly 4% and is threatening to test the March 23rd lows, near 60.25.
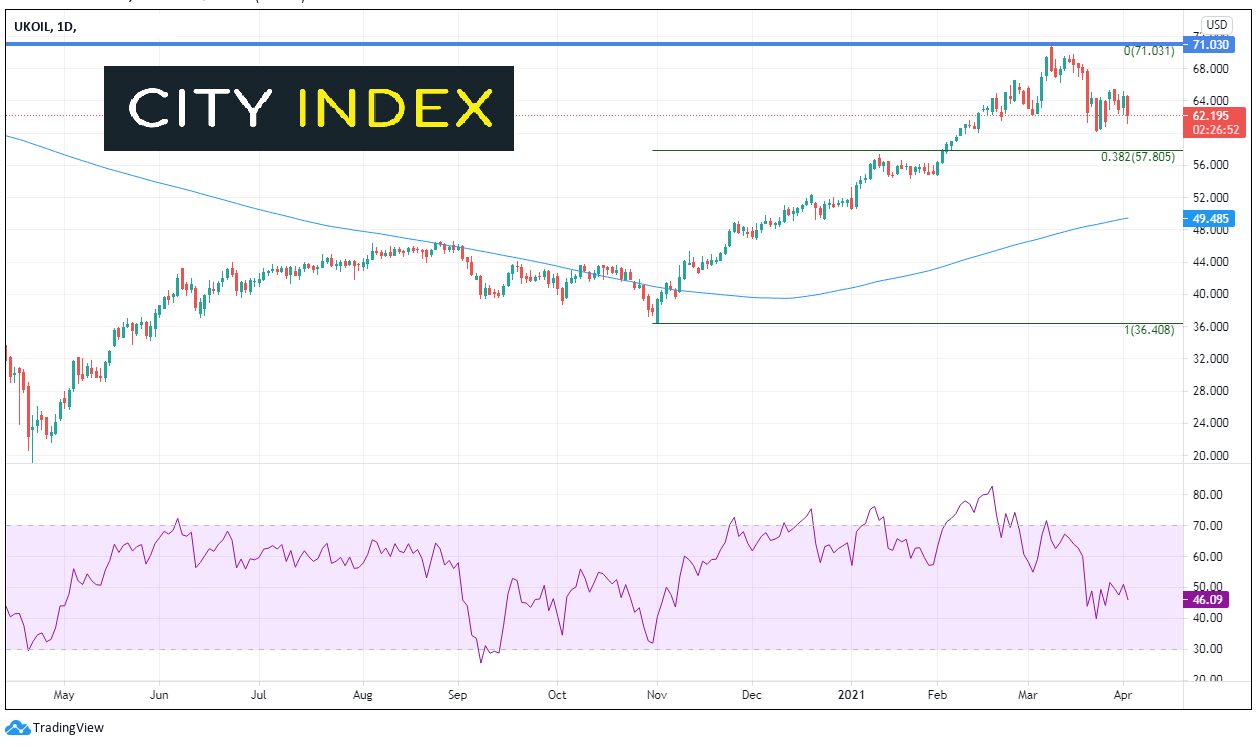
Source: Tradingview.com, City Index
On a 240-minute timeframe, UKOIL broke lower today out of a symmetrical triangle near 62.90, which is the first level of resistance. First support is at the March 21st lows near 60.25 followed by the 38.2% Fibonacci retracement level from the November 2nd lows to the March 8th highs bear 57.82. Next support is the 200 Day Moving Average (see daily) at 49.49. Resistance is at the bottom, upward sloping trendline of the triangle, then the downward sloping trendline from the triangle (which confluences with the March 21st highs near 65.38. Additionally, the March 10th lows act has horizontal resistance near 66.31.
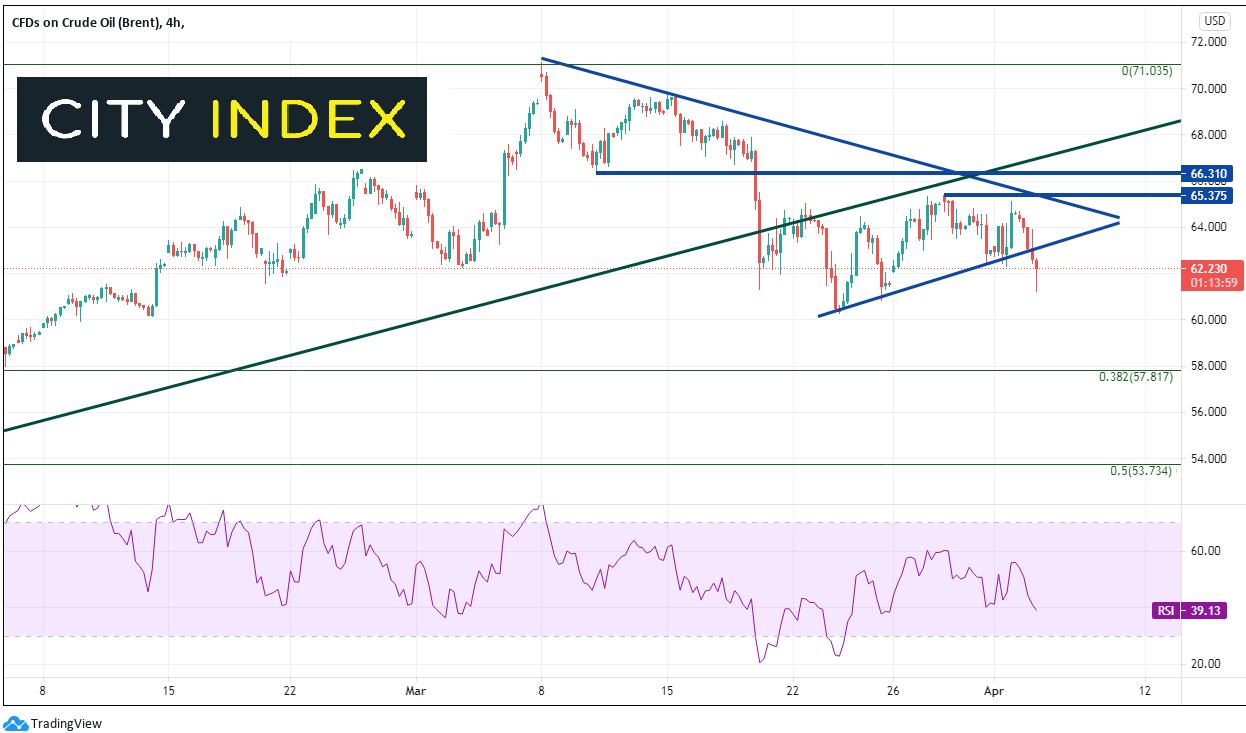
Source: Tradingview.com, City Index
Oil is lower today across the board. However, with the strong NFP employment numbers on Friday and the stronger than expected ISM data from the US, traders may be looking for more attractive levels to buy. Remember that many markets were closed, and traders were off today. As a result, traders could possibly walk in tomorrow, see prices down roughly 4%, and start scooping up the offers!
Learn more about oil trading opportunities.
Latest market news
Today 11:14 AM
Today 08:28 AM
Yesterday 03:30 PM
Yesterday 01:23 PM
Yesterday 11:00 AM
Latest Brent articles
February 21, 2024 03:30 PM
November 28, 2023 09:05 PM
November 20, 2023 08:26 PM
November 8, 2023 06:11 PM