


November 22, 2021 10:15 PM
Last week, after Joe Biden got off the phone with China’s President XI, China announced they would be releasing oil from their reserves. Whether that was the reason China released oil from their National Food and Strategic Reserves or not, doesn’t really matter. (China also released oil from their reserves back in September). However, upon Joe Biden’s urging, today Japan and India also released oil from their own reserves. Later in the day, the US followed suit and announced it would be releasing oil from is Strategic Petroleum Reserves. The amounts and timing of the release for each country is still undecided, however the US may release up to 35 million barrels of oil. South Korea may be next to announce.
What factors move the price of oil?
But what does that mean for OPEC+ when they meet again at their next meeting on December? Probably not much. The release from the SPRs is already priced into the market. As we wrote last week, prices may have been moving lower on speculation that these countries may release oil from their reserves. In addition, OPEC+ had said at their last meeting that they would not increase supply due to the lack of the demand from the uncertainty around the coronavirus. With the reemergence of the virus in Europe, their outlook probably won’t change much when they meet in early December. So how much more room could WTI have on the downside?
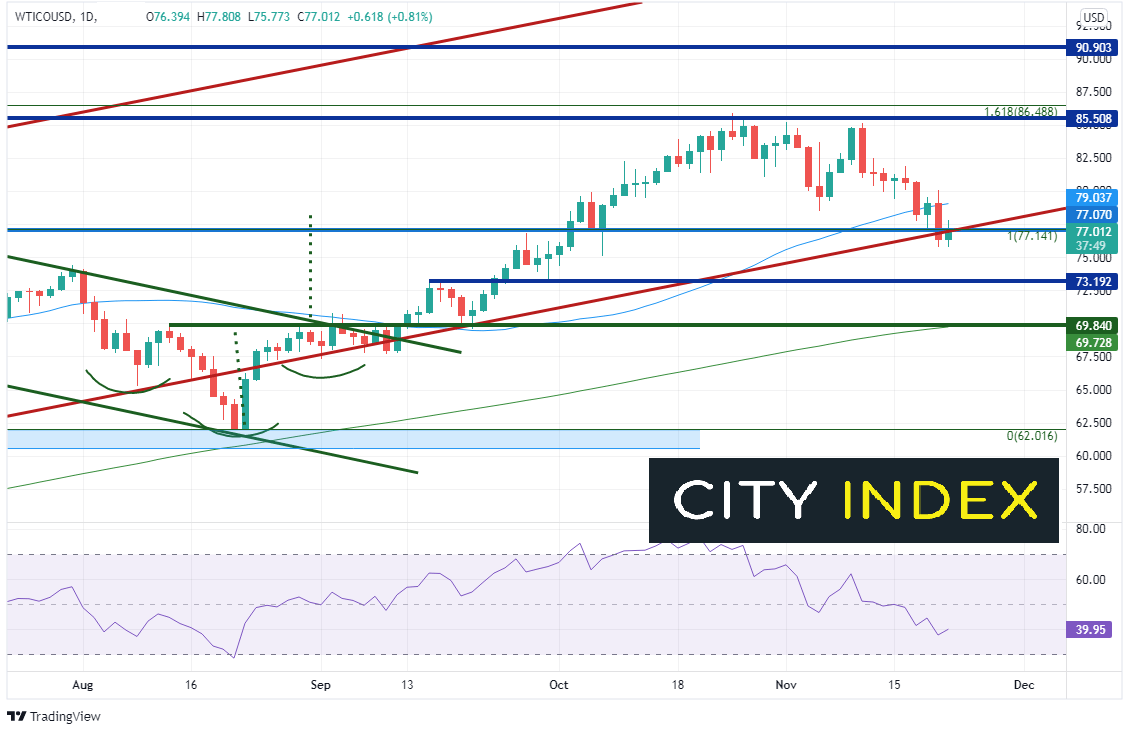
WTI crude oil had been moving lower since it put in a bearish engulfing candlestick on November 10th, from 85.15. Today, price reached a low of 75.77.
Source: Tradingview, Stone X
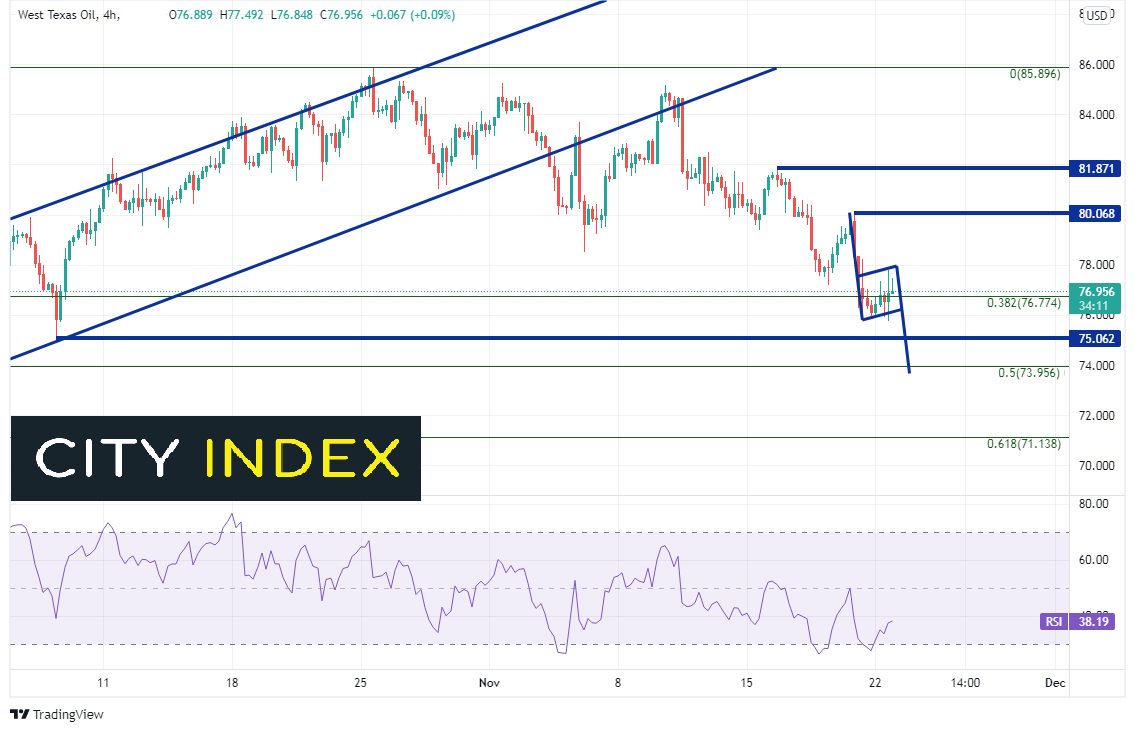
Oil pulled back to the 38.2% Fibonacci retracement level from the lows of August 22nd to the highs of October 25th. The price pattern on a 240-minute timeframe targets just below 74.00, which is also the 50% retracement from the same timeframe.
Source: Tradingview, Stone X
Trade USD/CAD now: Login or Open a new account!
• Open an account in the UK
• Open an account in Australia
• Open an account in Singapore
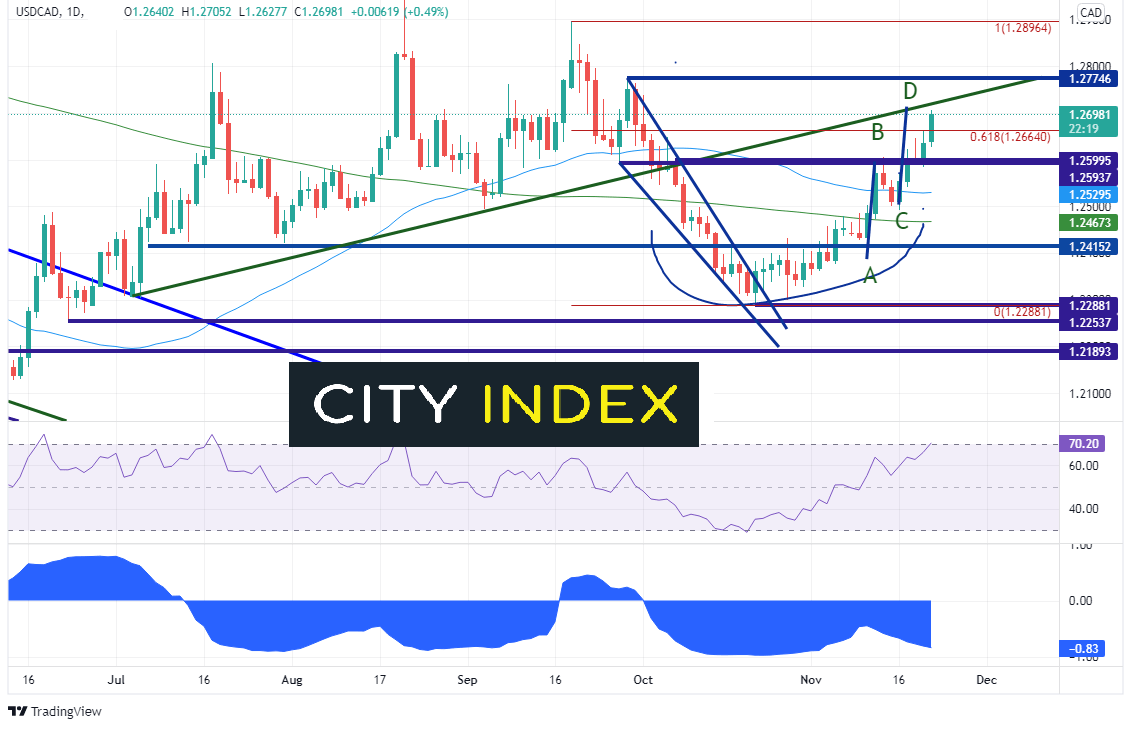
The correlation coefficient between WTI can USD/CAD is -0.83. As we often discuss, USD/CAD and Crude oil have an inverse correlation. Anything below -0.80 is considered a strong negative correlation. On a daily timeframe, USD/CAD broke through the 61.8% Fibonacci retracement from the September 20th highs to the October 21st lows at 1.2664 and rose to the target of the AB=CD formation, near 1.2710. In addition, the pair stalled at the upward sloping trendline dating back to July 5th.
Source: Tradingview, Stone X
Both Crude Oil and USD/CAD at support and resistance, respectively, on the daily timeframe. If WTI crude oil holds, USD/CAD may move lower. However, if WTI does complete the flag pattern on the 240-minute timeframe, one USD/CAD may push incrementally higher and reach the target for the descending wedge and horizontal resistance at 1.2775!
Whatever the reason that crude moved lower, one has to wonder how much room WTI has on the downside. Is it a “sell the rumor, buy the fact”, or was it lower due to the expected lack of demand? With the increase in oil from the SPRs, OPEC+ is likely still on hold at the next meeting, which may give Crude a bounce and may push USD/CAD lower!
Learn more about forex trading opportunities.
Latest market news
Yesterday 08:33 AM
Latest USD/CAD articles
April 16, 2024 04:24 AM
November 21, 2023 12:00 PM
November 10, 2023 04:00 PM
October 27, 2023 01:33 PM