


Ocado is due to release a Q4 trading update on Thursday 10th December.
Covid has been generous to Ocado. Ocado has undeniably be a standout winner from the covid crisis which accelerated a trend to online shopping.
As with all supermarkets sales surged back in the first lockdown. However, unlike other supermarkets which struggled to cope with surging online demand Ocado, the nation’s only dedicated online supermarket was able to scale up quickly, there were of course a few teething problems as delivery slots became scarce and a crash or two on the website but these were quickly overcome enabling the so called “Microsoft of retailing” to take advantage of the rapid change is shopping habits; habits which could well be here to stay.
Focus on M&S
When the update is released, attention will be firmly on how the tie up with Marks & Spencer is going. The joint venture has now completed three months and expectations are running high. Kantar data earlier in the week pointed to 38.3% growth over the last 12 week period compared to last year. The group forecasts a full year boost to revenue of $30 million by the end of 2021, in addition to a small hit to earnings.
When the update is released, attention will be firmly on how the tie up with Marks & Spencer is going. The joint venture has now completed three months and expectations are running high. Kantar data earlier in the week pointed to 38.3% growth over the last 12 week period compared to last year. The group forecasts a full year boost to revenue of $30 million by the end of 2021, in addition to a small hit to earnings.
More than one string to its bow
The trading statement could also provide additional insight into the technology side of the business. Ocado sells its unique warehouse technology to other international supermarket groups which has helped Ocado up its earnings expectation to £60 million FY up from £40 million just a few months ago. Since then it has also agreed to buy US Kindred Systems an AI systems developer for picking and packing and Haddington Dynamics a robotic arm maker as it continues to focus on advancing its tech systems.
The trading statement could also provide additional insight into the technology side of the business. Ocado sells its unique warehouse technology to other international supermarket groups which has helped Ocado up its earnings expectation to £60 million FY up from £40 million just a few months ago. Since then it has also agreed to buy US Kindred Systems an AI systems developer for picking and packing and Haddington Dynamics a robotic arm maker as it continues to focus on advancing its tech systems.
Chart thoughts
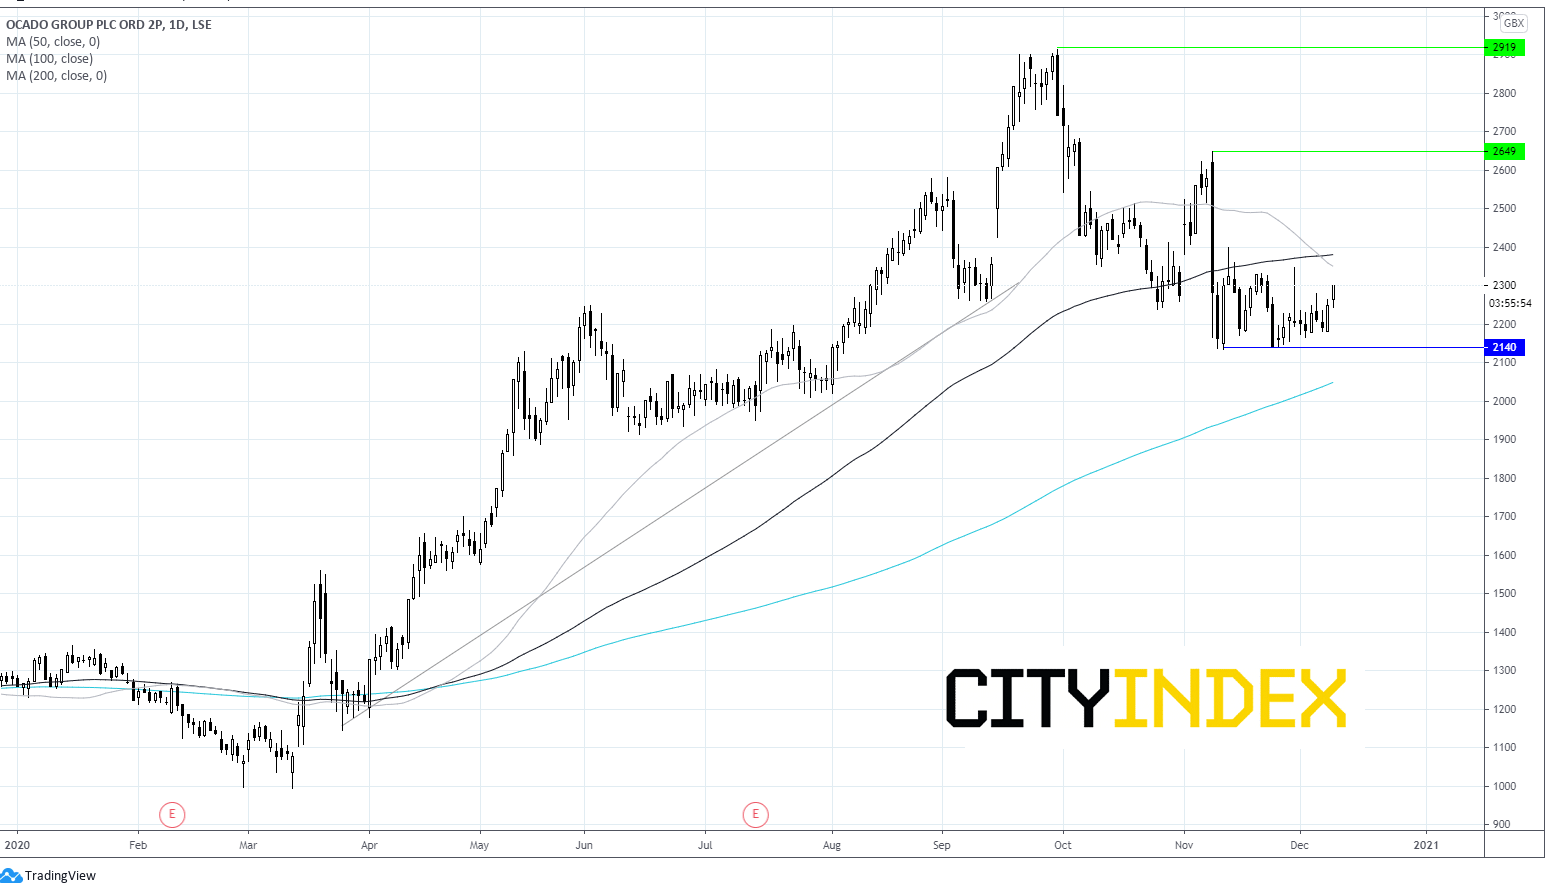
Ocado’s share price is currently trading around 2200p, after having eased back from 2900p a 12 month high reached at the end of September. The stock trades below its 50 & 100 sma on the daily chart. Additionally, the 50 sma has crossed below the 100 sma painting a bearish signal.
However, horizontal support at 2140p has proved to be strong across November with the price rebounding from here late last month. Should this level hold then we would look for a move above 2400 (100 sma) to negate the near-term bearish bias and signal a move higher toward 2650 (Nov high).
On the flip side a break-through 2140 could see the 200 sma being tested at 2046, which could signal the start of a more pronounced sell off.
Latest market news
Today 11:14 AM
Today 08:28 AM
Yesterday 03:30 PM
Latest Equities articles
April 12, 2024 02:28 AM
April 7, 2024 08:46 PM
March 31, 2024 11:22 AM
