NZD USD traders crying over spilt milk 8230 could 6400 be next
If I had said yesterday that China’s quarterly GDP would beat expectations, backed up by strong growth in Industrial Production and Retail Sales, you would logically […]
If I had said yesterday that China’s quarterly GDP would beat expectations, backed up by strong growth in Industrial Production and Retail Sales, you would logically […]
If I had said yesterday that China’s quarterly GDP would beat expectations, backed up by strong growth in Industrial Production and Retail Sales, you would logically expect NZD/USD to be trading higher. After all, China is New Zealand’s second-largest trading partner behind Australia, which is itself heavily dependent on growth in the world’s largest economy. Unfortunately, this simplified analysis ignores one critical factor: the price of milk.
As regular readers know, dairy products make up fully one-third of NZ exports, and today’s Global Dairy Trade (GDT) auction showed that dairy prices fell a staggering 10.7% over the last two weeks down to the lowest level in over a decade. The dairy index has now fallen for nine consecutive biweekly periods after rising for the previous six readings at the start of the year. This disappointing auction, along with a more-hawkish-than-expected speech by Fed Chair Janet Yellen, conspired to drive NZD/USD to a fresh five-year low under .6600.
Looking ahead, traders are keeping a close eye on New Zealand’s quarterly CPI reading, which is expected to show 0.5% inflation q/q after last quarter’s disappointing -0.3% figure. Further down the road, expectations are growing that the Reserve Bank of New Zealand (RBNZ) will cut interest rates to 3.0% in its highly-anticipated meeting next week, and tonight’s CPI reading will no doubt help shape expectations for this critical monetary policy decision.
Technical view: NZD/USD
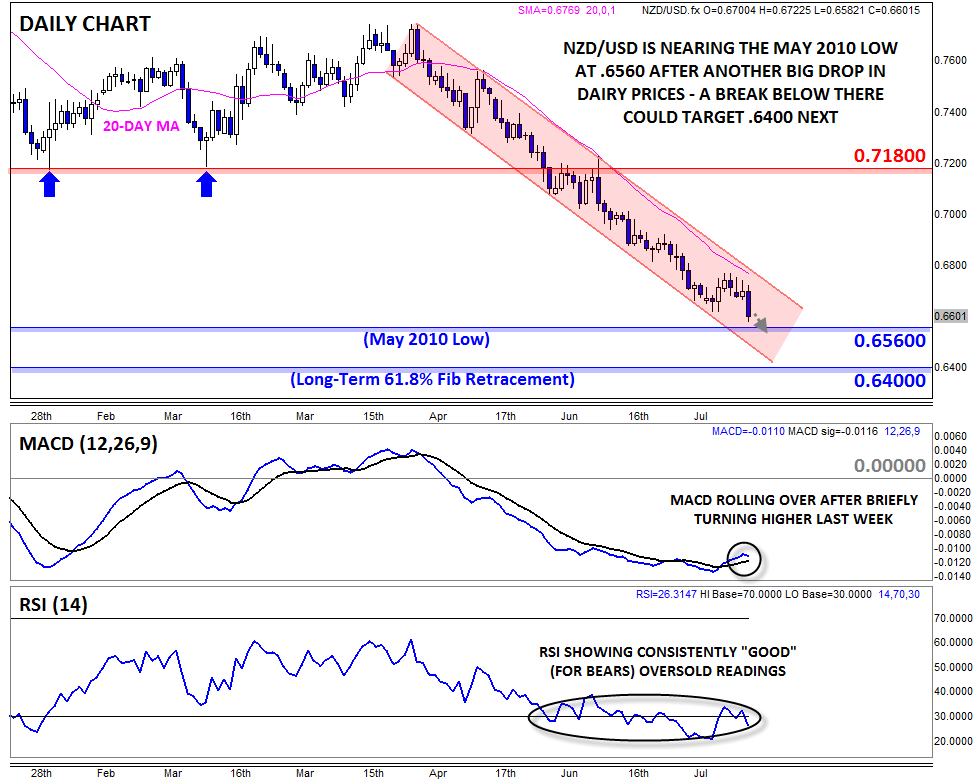
On a technical basis, the pair is approaching support at .6560 from the minor low in May 2010, which could bring some bulls out of the woodwork to put a momentary floor under prices. That said, the downtrend appears as healthy as ever: the pair remains solidly within its three-month bearish channel and below resistance at the 20-day MA (pink line on the chart below). Digging deeper, the MACD is showing signs of rolling over after briefly turning higher last week, and the RSI continues to show “good” (for bears) oversold readings. While an oversold reading in an oscillator like RSI is often seen as a short-term bullish sign, the consistently low reading in the indicator signals strong, unrelenting selling pressure that could continue to drive rates lower in the days and weeks to come.
In terms of levels to watch, the next hurdle for bears is the aforementioned previous low at .6560, but if that level gives way, a continuation down to the longer-term 61.8% Fibonacci retracement around .6400 could be in play next. The near-term bearish bias will remain intact as long as rates remain below the upper trend line and 20-day MA (currently around the .6970 level).
 Source: City Index