NZD USD Short squeeze rally on the cards
The kiwi may not be everyone’s favourite fruit, myself included, but its namesake currency pair is one of the most technically-friendly pairs out there at […]
The kiwi may not be everyone’s favourite fruit, myself included, but its namesake currency pair is one of the most technically-friendly pairs out there at […]
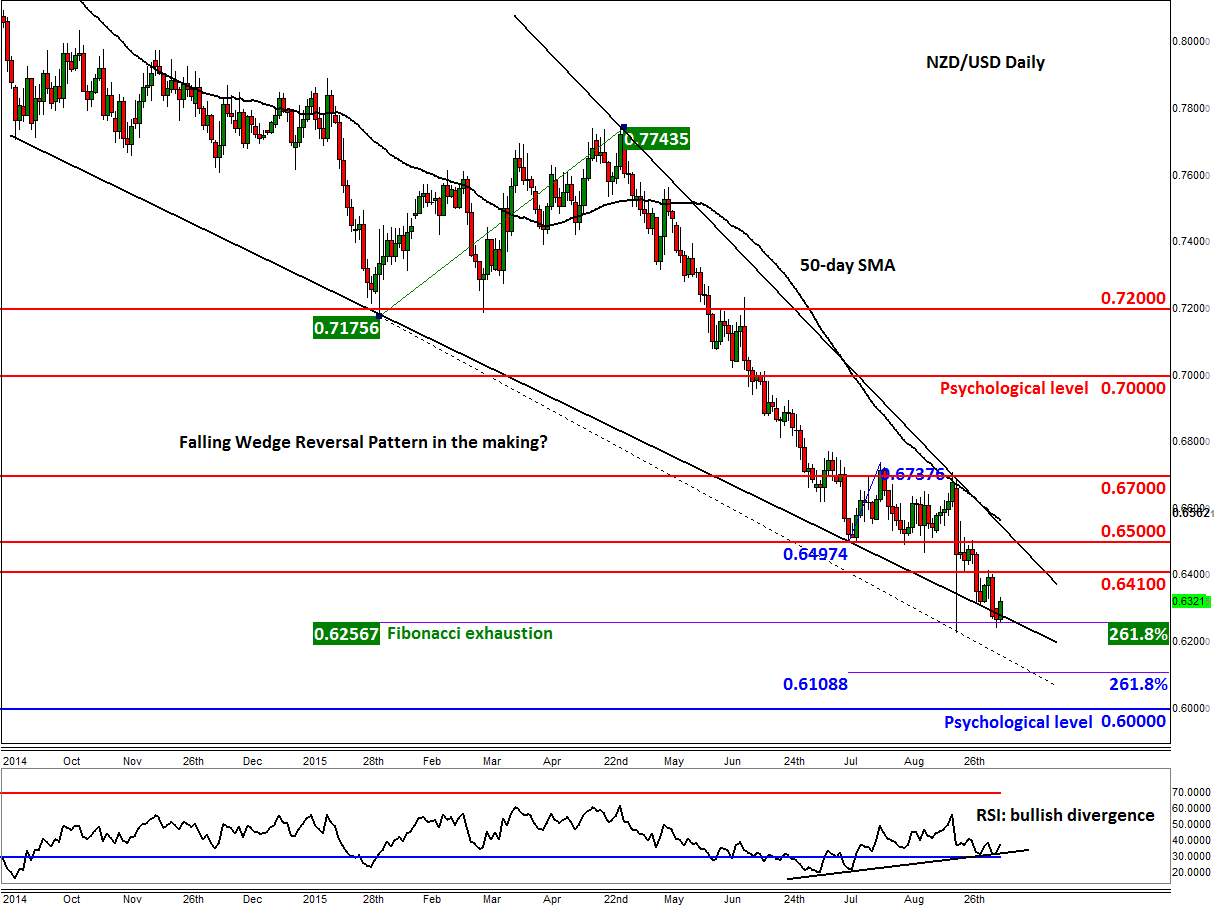
The kiwi may not be everyone’s favourite fruit, myself included, but its namesake currency pair is one of the most technically-friendly pairs out there at the moment. If the doubters needed to see one chart right now to be convinced that technical analysis (if used correctly) does really work, then they should look no further than the daily chart of the NZD/USD, below. Virtually all of the red horizontal lines drawn on the chart show some of most obvious entry points for the bears. These levels plainly show how a key support level, once broken, turns into resistance. The most obvious examples of these are at 0.6410, 0.6500 and 0.7200. In addition, the lower trend line of the potential falling wedge pattern, for example, has been clearly respected by traders: every time price has got to this trend line, we have seen a counter-trend move as the sellers booked profit.
But have the bears milked it enough? Is time for the bulls to take control? Although it is way too early to say that this may be the case, there are some early warning signs that suggest a short-squeeze rally could be on the cards. Take for example the RSI. The momentum indicator has now created a triple bullish divergence with price i.e. it has created three higher lows while price has made lower lows. This suggests that the bearish momentum is weakening. On top of this, price itself has reached an exhaustion point around 0.6255 – the 261.8% Fibonacci extension of the most recent significant rally that occurred between February and April. On top of all this, the kiwi appears to be getting squashed by two converging trend lines, which point to an inevitable breakout – will it be to the upside?
That being said, the trend is still bearish, so it may pay to be patient if you are a bull. A decisive break above support-turned-resistance level of 0.6410 may be the first clear sign that things are about to turn bullish for the kiwi, though the slightly longer-term-focused traders may wish to wait for an actual breakout from the potential falling wedge pattern before taking jumping on the bandwagon. Should the NZD/USD push through some short term resistance levels as the chart suggests it might then we could see a sharp short-squeeze rally towards 0.6700 or even the psychological level of 0.7000 before it decides on its next move.
However if the potential bullish scenario as described above does not materialise then there are not many further key support levels that could provide a floor to prices until all the way to the next psychological round handle of 0.6000. There are, however, a couple of Fibonacci extension levels to watch, including the one shown on the chart, in blue, at just below 0.6110. Meanwhile the RBNZ could dash the bulls’ hopes by delivering a significantly bearish policy statement on Wednesday evening UK time or Thursday morning New Zealand time. The central bank is expected to cut rates to 2.75% from the current 3.00 per cent.