NZD USD set for a big drop
The New Zealand dollar’s weakness was exacerbated overnight when inflation data showed consumer prices fell by a surprisingly large 0.5% in the fourth quarter of […]
The New Zealand dollar’s weakness was exacerbated overnight when inflation data showed consumer prices fell by a surprisingly large 0.5% in the fourth quarter of […]
The New Zealand dollar’s weakness was exacerbated overnight when inflation data showed consumer prices fell by a surprisingly large 0.5% in the fourth quarter of 2015. Unsurprisingly, the biggest contributor for the fall in inflation was a 7% drop in petrol prices, while falls in vegetable prices and those of tradable goods and services also contributed to the overall decline. The Kiwi had already been undermined by a 1.4% drop in the GDT Price Index the day before, though the 0.5% fall in whole milk powder prices was insignificant compared to the big 4.4% drop in the previous auction. Nevertheless, the currency fell across the board as the continued weakness in commodity prices and now inflation suggests the Reserve Bank of New Zealand may move to cut rates further. However, analysts currently do not expect the RBNZ to trim rates at next Wednesday’s meeting. Instead, Governor Graeme Wheeler may prepare the market for a potential cut at the March 9 meeting. But there is the potential for a surprise and traders need to be alert to that possibility.
The US dollar meanwhile has been rising sharply against all commodity prices and today hit a fresh all time high against the Russian ruble and multi-year high against the Canadian dollar. It has also performed well against the British pound, though not so well against the euro or the yen as the funding currencies have attracted safe haven demand due the on-going stock market sell-off. The dollar’s rally did however take a hit after US CPI inflation unexpectedly fell 0.1% month-over-month and housing starts also disappointed expectations.
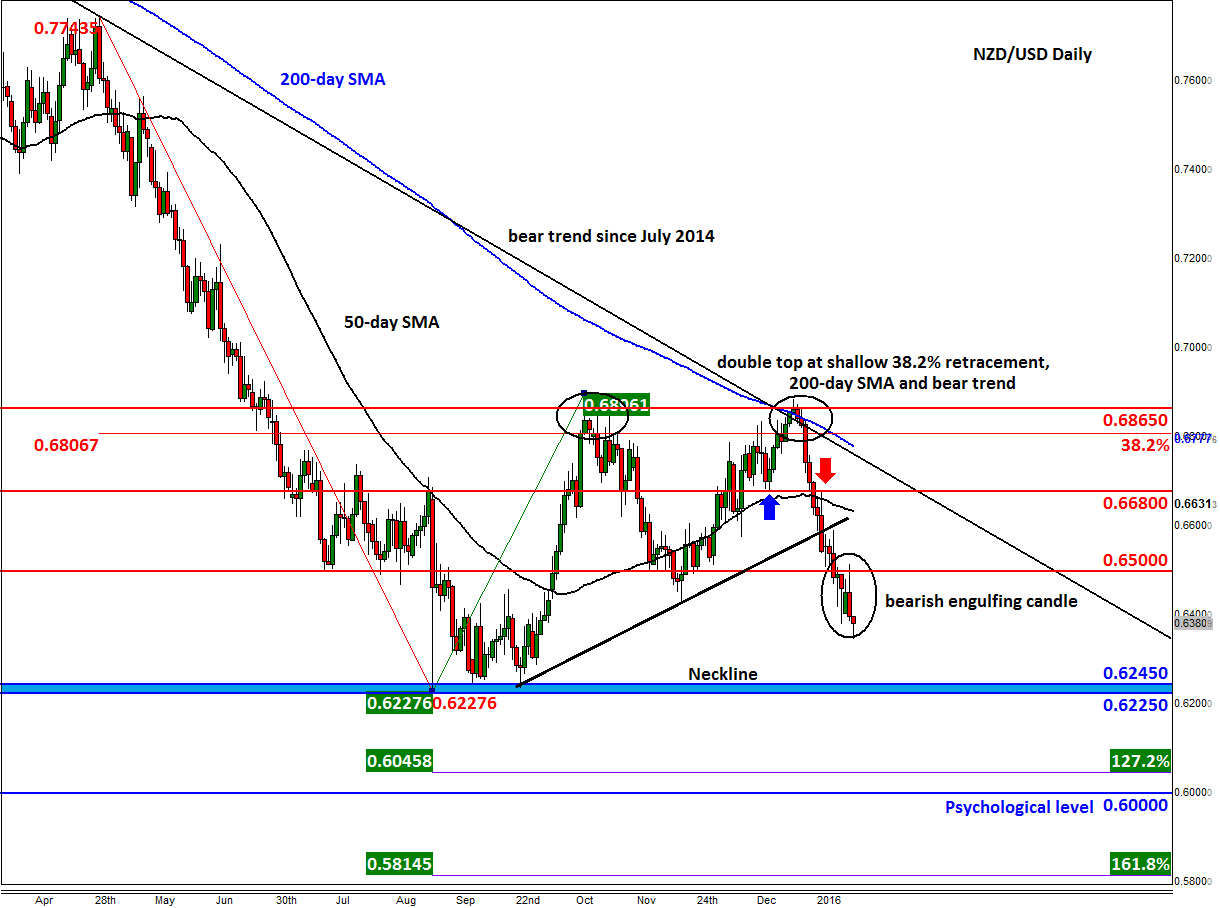
From a technical perspective, the NZD/USD is looking bearish after its most recent recovery ended around 0.6865 twice, the second time at the end of December. Thus, it may have created a double top there, which is more significant because of the 38.2% Fibonacci retracement level at 0.6805 being at close proximity. This represents a shallow pullback in a bear trend, meaning the sellers have remained in full control. What’s more, a bearish trend that goes back to July 2014 converged with the 200 moving average there, too. So the turnaround hasn’t surprised us at all.
In this month, the NZD/USD has provided us a few signals to suggest the bear trend may continue for the foreseeable future. For a start, it has taken out the key short term supports at 0.6680 and then 0.6500; these levels have since turned into resistance. Old supports become new resistances – bearish characteristics. In addition to all this, the NZD/USD has formed a bearish engulfing candlestick pattern on its daily chart, further cementing the bearish argument.
Thus, unless it now rises back above the 0.6500 resistance on a closing basis, the path of least resistance would continue to remain to the downside. In fact, for as long as the bearish trend holds, the bears will remain happy. The next potential bearish targets are around 0.6225-45, the low from last year and the neckline of the double top pattern, followed by the Fibonacci extension levels at 0.6045 (127.2%) and 0.5815 (161.8%). One other bearish target could be the psychological 0.60 handle.