NZD USD clears major resistance zone
A surprise rate cut from the RBNZ a couple of weeks ago was enough to send the New Zealand dollar tumbling by a couple of […]
A surprise rate cut from the RBNZ a couple of weeks ago was enough to send the New Zealand dollar tumbling by a couple of […]
A surprise rate cut from the RBNZ a couple of weeks ago was enough to send the New Zealand dollar tumbling by a couple of hundred pips. However, there was no further follow-through in the selling pressure once the Kiwi reached the key 0.6600 support area. It has since bounced back sharply, helped in part by the rebounding commodity prices and a falling US dollar in response to mixed-bag data from the world’s largest economy and also dovish comments from top Federal Reserve officials, most recently from Chairwoman Janet Yellen on Tuesday.
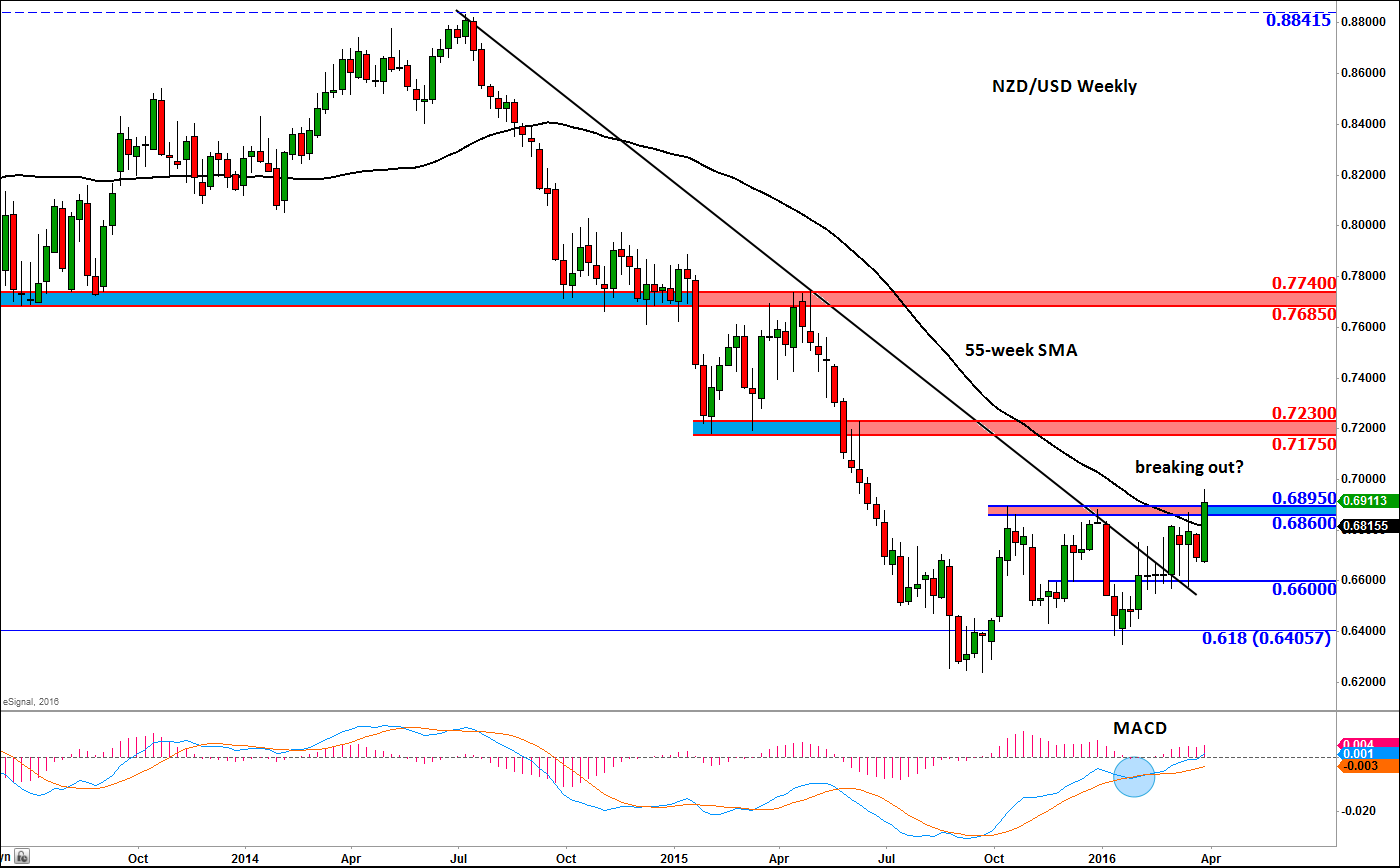
The resulting rally has helped to carve out a large bullish engulfing candle on the weekly chart of the NZD/USD, although this may change by the end of this week depending on the market’s reaction to the upcoming US data releases – the most important of which is likely to be Friday’s nonfarm payrolls data. Regardless of the shape of the weekly candle, the Kiwi has already broken though a major resistance zone in the 0.6860-0.6895 area. The bulls will need to hold their ground here by the close of play this week in order to confirm the breakout. While the NZD/USD holds above this area, the path of least resistance will be to the upside.
In addition to this week’s bullish engulfing candlestick formation, the NZD/USD has already created several other bullish-looking patterns on its charts, suggesting a significant bottom may have already been formed. On the weekly chart, it has created several doji candles around the bearish trend line that had been in place since July 2014. These indecisive-looking price patterns would have normally led to strong selling pressure if this was still a downward-trending market. But the lack of any significant follow-through in that direction strongly suggested that the trend was turning bullish and that a breakout was forthcoming. When the Kiwi finally took out the long-term bearish trend line, it formed a large bullish engulfing candle on the weekly time frame. Although there was no immediate follow-through ahead of that RBNZ policy decision, there has also been little selling interest with the buyers continually stepping in around the 0.66 handle.
Now that the buyers appear to have won this bull-bear battle, fresh momentum buying interest may see the Kiwi rise towards the next key reference points, as shown on the chart. The bulls may aim for the psychological handle of 0.7000 as their next immediate target. Above this level, the next potential resistance area is between 0.7175 and 0.7230 where the previous support meets the 38.2% Fibonacci retracement level (not drawn on the chart). The momentum indicator MACD, which had already formed a bullish crossover, is now trying to move above zero. This is further confirmation the bullish breakout.
At this stage, a break back below the previous resistance area of 0.6860-0.6895 would be deemed a bearish outcome in the short-term, while a move below the key support at 0.6600 would completely invalidate the breakout.