


We suggest keeping a close eye on the monthly close on NZD, given the importance of the technical juncture it sits at.
We can see on the monthly close that that NZD/USD is on the cusp of testing a key, long-term level. Prices are trading just above the August 2015 low and close to testing the bullish trendline for the October 2000 low, placing key support around 0.6344. Furthermore, a four-year topping pattern is also on the cusp of being confirmed which, if successful, could see NZD/USD drop to the mid-50’s.
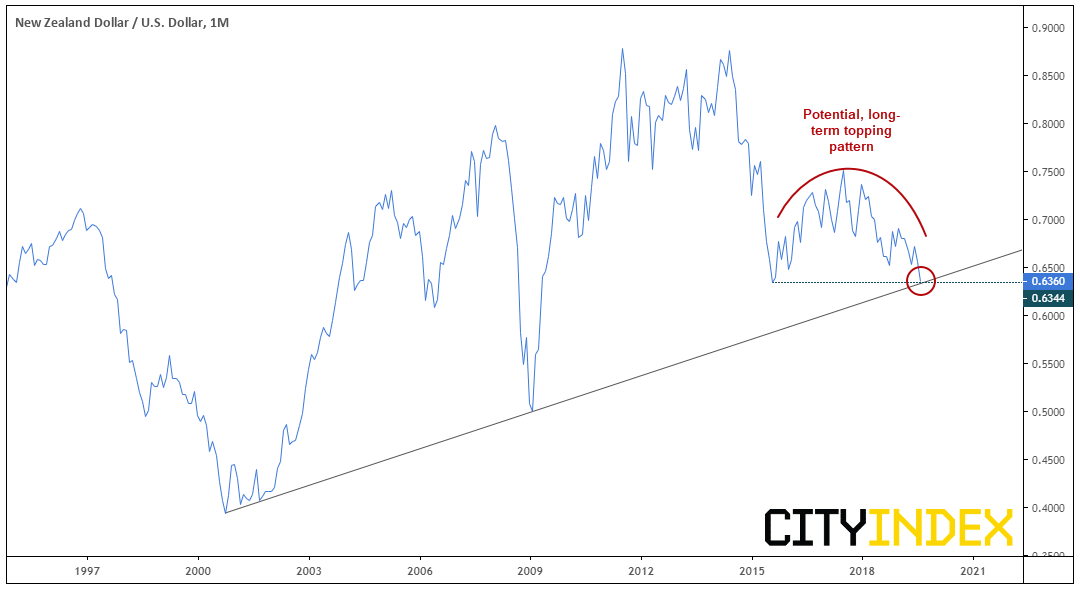
Now it’s not every day a market gets to approach such a long-term level. In fact, NZD has only been close to this trendline three times since. And whilst most retail traders tend to focus on smaller timeframes (and use bar of candlestick charts), it’s worth noting that large fund managers or investors still observe closing prices, especially around such significant. Therefore, regardless of your timeframe, we suggest you keep an eye on the monthly close is it could have a material impact on prices through September.
However, we could see NZD/USD bounce from current levels over the near-term, before extending losses:
- This is a long-term, important level (which rarely break firt time around form my own observations)
- The current decline has lacked any real mean reversion
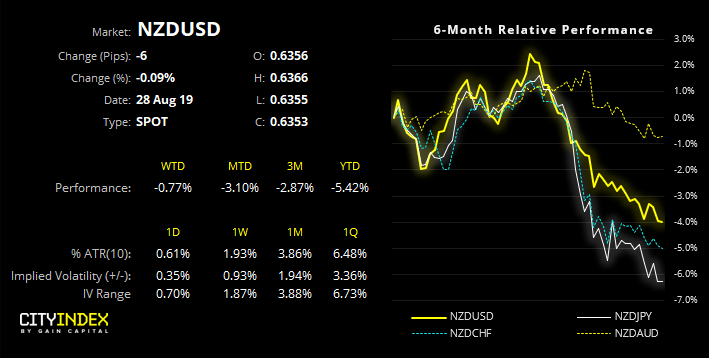
- RBA have just cut 50bps are don’t appear in a rush to ease further. RBA Governor Orr said recently he is “pleased where we are at with policy” and just today added “monetary policy remains as effective as ever” at current setting
- OIS markets are placing a low probability of further easing any time soon, at around 4% for next month. In fact they suggest around a 50% chance of a cut in early 2020.
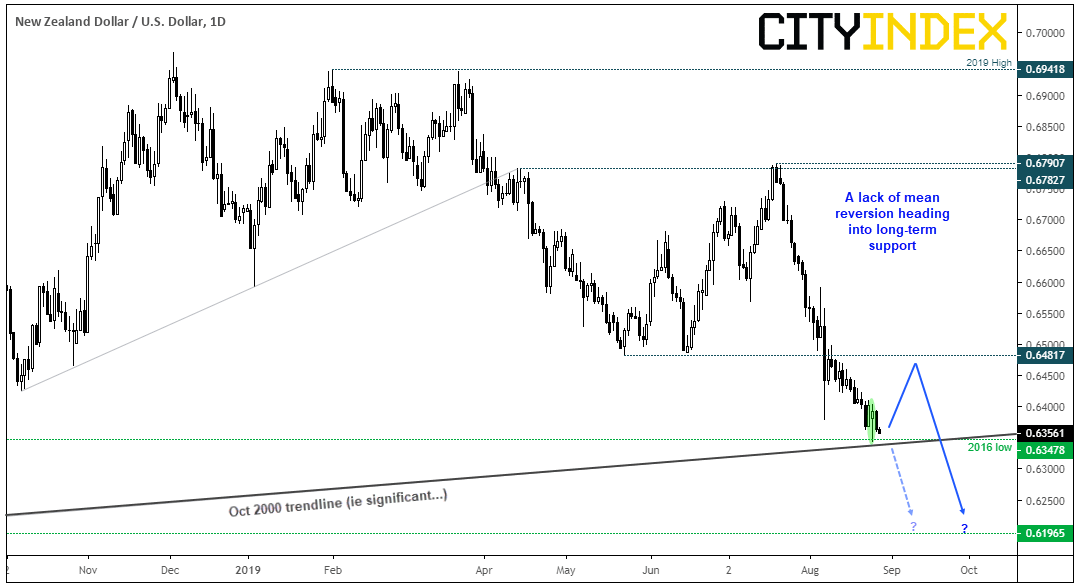
Monday produced a bullish hammer to show a hesitancy to break lower, although prices are sniffing around those lows at time of writing. If we are to see a bounce, traders could look for areas of weakness below 0.6482 to consider fading into. However, if we’re to see momentum shift notably higher (like a V-bottom) then we’d want to step aside over the near-term.
Obviously, let price action be your guide, so don’t fight the trend; if it breaks lower, so be it. But do remember to keep an eye on the monthly close as we’ve seen a few instances this year (ie Euro to name just one) where we saw a false break of key support heading into a new month, only to see prices violently reverse before month end. Besides, given the size of the topping pattern on the monthly chart, there could be plenty of opportunity to short it over the coming months if it does indeed break convincingly lower.
Latest market news
Latest New Zealand articles
April 12, 2024 03:39 AM
October 4, 2023 01:51 AM
July 12, 2023 03:14 AM
May 24, 2023 03:17 AM