NZD CAD on shaky footing
Now last week we reported that the NZD/USD was about to break down, due among other things to the impact of an appreciating US dollar. […]
Now last week we reported that the NZD/USD was about to break down, due among other things to the impact of an appreciating US dollar. […]
Now last week we reported that the NZD/USD was about to break down, due among other things to the impact of an appreciating US dollar. This pair has now broken below the 0.6950 support and is thus looking rather bearish at the start of this week. The AUD/USD is likewise looking weak while the oil-proxy CAD/USD (USD/CAD inverted) has found it very difficult to resist the dollar’s strength, even though oil prices have rallied sharply. But taking the dollar out of the equation, we could easily see the impact of the firmer oil prices on the AUD/CAD and NZD/CAD: both crosses have fallen sharply in recent days.
In fact, the NZD/CAD will be in focus this week due to upcoming high-impact economic data from both Canada and New Zealand, and because of a technical breakthrough. More on the technical later but with oil prices breaking out of their recent ranges, coupled with a neutral Bank of Canada and a dovish Reserve Bank of New Zealand, the NZD/CAD should, in theory, fall further lower over time. In fact, that motion appears to have already started.
The key data to watch from Canada this week includes wholesale sales on Tuesday, Consumer Price Index and retail sales on Thursday, followed by the monthly GDP estimate on Friday. Because of its high frequency, the GDP data will unlikely have much of an impact on the CAD. But CPI and retail sales will, especially if these numbers show large deviations from expectations. From New Zealand, we will also have GDP, only it is the quarterly estimate and will thus be closely-watched by market participants. The GDP will be released late in the day on Wednesday or early morning on Thursday NZ time. In addition to GDP, we will also have Fonterra’s dairy auction on Tuesday which typically tends to move the NZD because dairy is NZ’s largest exports.
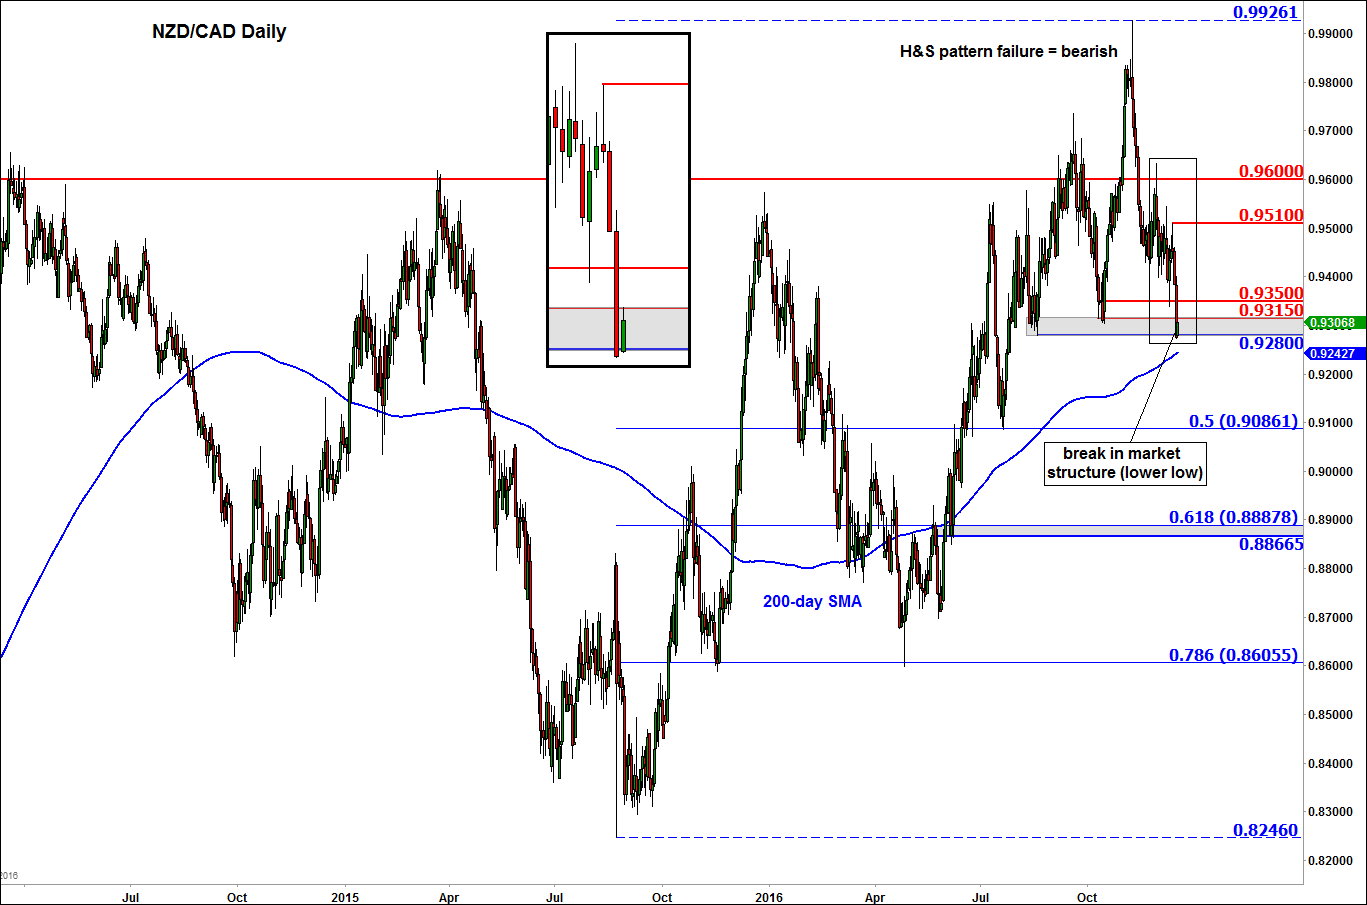
Indeed, technically the NZD/CAD looks very bearish after its recent breakout above the neckline of the head and shoulders pattern around 0.96 failed to lead to a significant follow-through in buying pressure as the cross eventually topped out around the 0.99 handle. Since that false breakout, the unit has been under severe pressure. On Friday, it closed at its lowest point both on the day and also the week. So far in this new week, we haven’t seen any follow-through in the selling pressure. But that could change because not only the trend is clearly bearish, there has been a break in market structure: the NZD/CAD has created a lower low relative to its previous swing low points around the 0.9280/0.9315 area. If and when price starts to move below this 0.9280/9315 region, it would confirm the breakdown. Consequently, we could see the onset of further follow-up technical selling. Thus the NZD/CAD could be on the verge of a collapse, potentially towards the levels shown in blue on the chart. At this stage, it would take a rally beyond the last swing high at 0.9510 or ideally above the 0.9600 resistance level to technically signal the end of the downward trend. Unless that happens or until we see a clear bullish pattern unfold on the NZD/CAD, the path of least resistance is to the downside.