NZD CAD could plunge as rising oil data underpins CAD
The first trading week of 2017 is nearly over. US stock indices have hit new record high with Dow coming to within a point of […]
The first trading week of 2017 is nearly over. US stock indices have hit new record high with Dow coming to within a point of […]
The first trading week of 2017 is nearly over. US stock indices have hit new record high with Dow coming to within a point of hitting that 20K hurdle and crude prices turning back positive on the week after a wobble on the first trading day of the year. Economic data from around the wold has been positive, except the US where the jobs numbers were a little bit soft, although wages grew more strongly than expected. In contrast, Canadian employment figures were surprisingly strong. Here, 53,700 net jobs were created in December as full-time employment surged by 81,000 and part time jobs declined by 27,600.
With oil bouncing back and employment data surprising to the upside, the Canadian dollar has found good support against most of its rivals, though it was trading flat against the US dollar at the time of this writing. But against other commodity currencies, its outperformance was plain to see, especially the NZD/CAD.
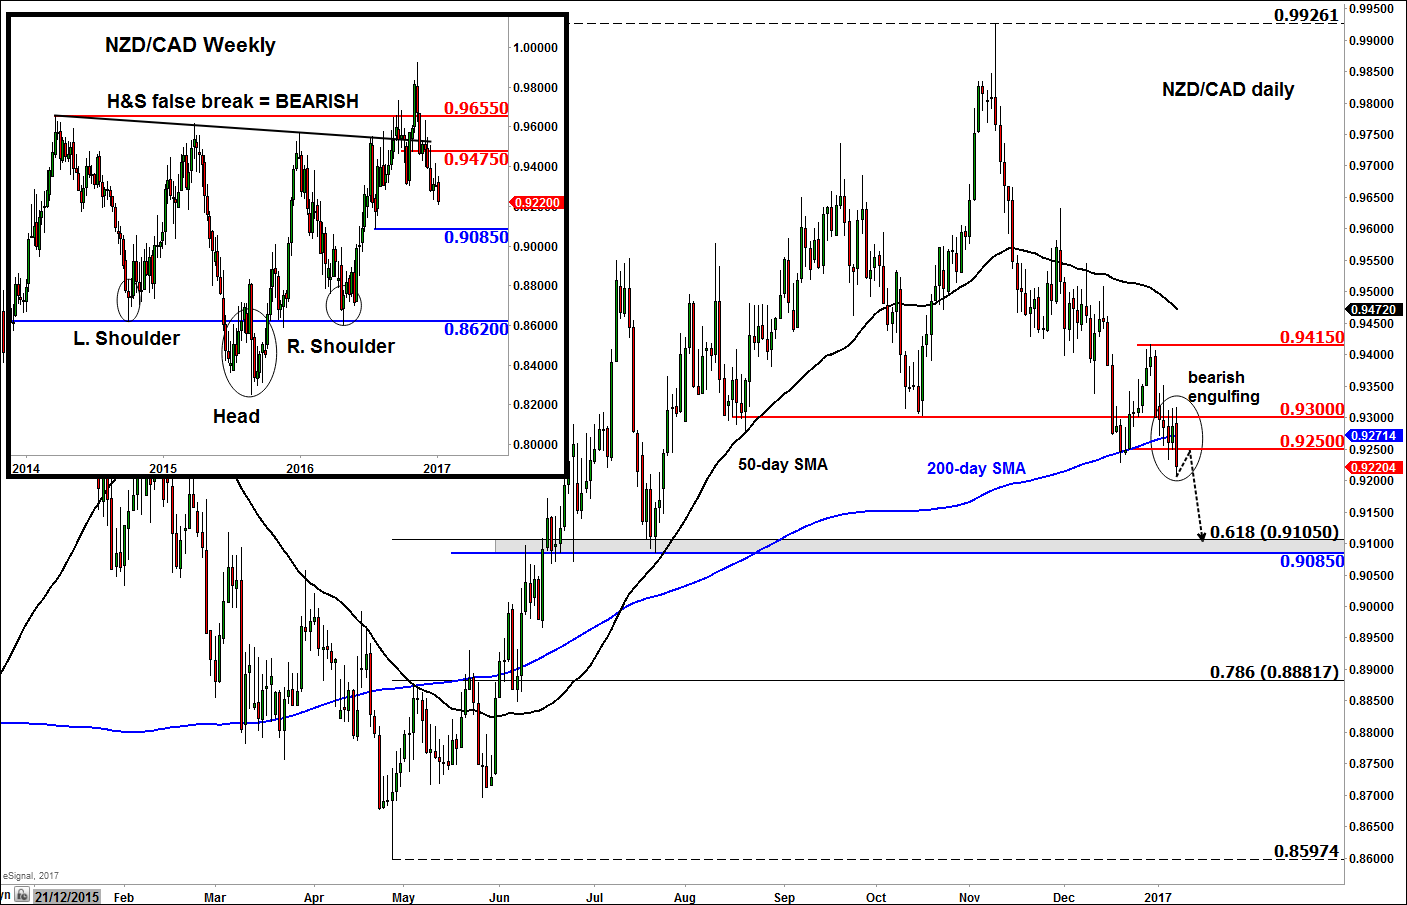
This NZD/CAD pair has been in a bearish trend ever since the long-term Head & Shoulders breakout failed to materialise into a rally (see the weekly chart in the inset). Since that ‘fake out’ the cross has been making lower lows and lower highs. This trend will only be over once there is a break in market structure (i.e. when a higher high is formed). Until that happen, the path of least resistance remains to the downside.
Indeed we are expecting the unit to continue to fall further, especially now that it has broken below the 200-day moving average. Although the day is not over yet, it looks like the NZD/CAD will form a bearish engulfing candle on its daily chart, which points to more selling pressure in early next week.
The next bearish objective would be the shaded area on the chart around 0.9085-0.9105: here the 61.8% Fibonacci level meets prior support. Potentially, it could fall a lot further over time given the long-term technical damage.
Our bearish bias would become invalid upon a break above the most recent swing high at 0.9415, though a break above 0.9300 would also weaken the bearish view.