


March 5, 2021 11:15 AM
Non-farm Payrolls strong as markets are unsure what to do
The NFP report showed a strong print in February for the headline number at +379,000 jobs created vs an expectation of +180,000. In addition, the January print was revised to +166,000 vs +49,000 previously. The unemployment rate beat as well, coming in at 6.2% vs 6.3% in January. Average hourly earnings remained unchanged at 0.2% MoM.
Although the market has been telling the Fed to be concerned about rising inflation expectations (by way for selling bonds, which raises yields), Powell indicated that they are not worried about inflation and they are even willing to let it run “hot” for a while, above their self-mandated 2%-3% target. The Fed’s focus right now is on JOBS, and the 10,000,000 that have not returned since the coronavirus struck 1 year ago. Although +379,000 doesn’t put much of a dent in that number, it does help. Most of these jobs were in the hospitality industry, which is beginning to see a return of workers. +355,000 were added in the hospitality sector. Although some people look at these as low wage jobs, these are many of the 10,000,000 jobs that were lost due to the pandemic. As the vaccine rollout continues, and the economy continues “reopening”, watch for jobs in this sector to continue to increase.
Yields spiked and stock indices initially moved lower on the NFP release. (Dare we say that stocks move higher and bonds move lower on good news?) However, the markets came back to their reverse logic, where good news is bad because it means the Fed may move up the “taper” timeline. 10-year yields reached a high of 1.622 today, after putting in a low of 1.39 on Wednesday! Although there is still time left in the day, a close below 1.537 on a daily timeframe would indicate a shooting star formation, and a possible pullback. 1.500 now acts as round number phycological support and Wednesday’s low of 1.49 confluences with the rising trendline from late January, acting as next support. Horizontal resistance from December 2019 crosses above at 1.683.
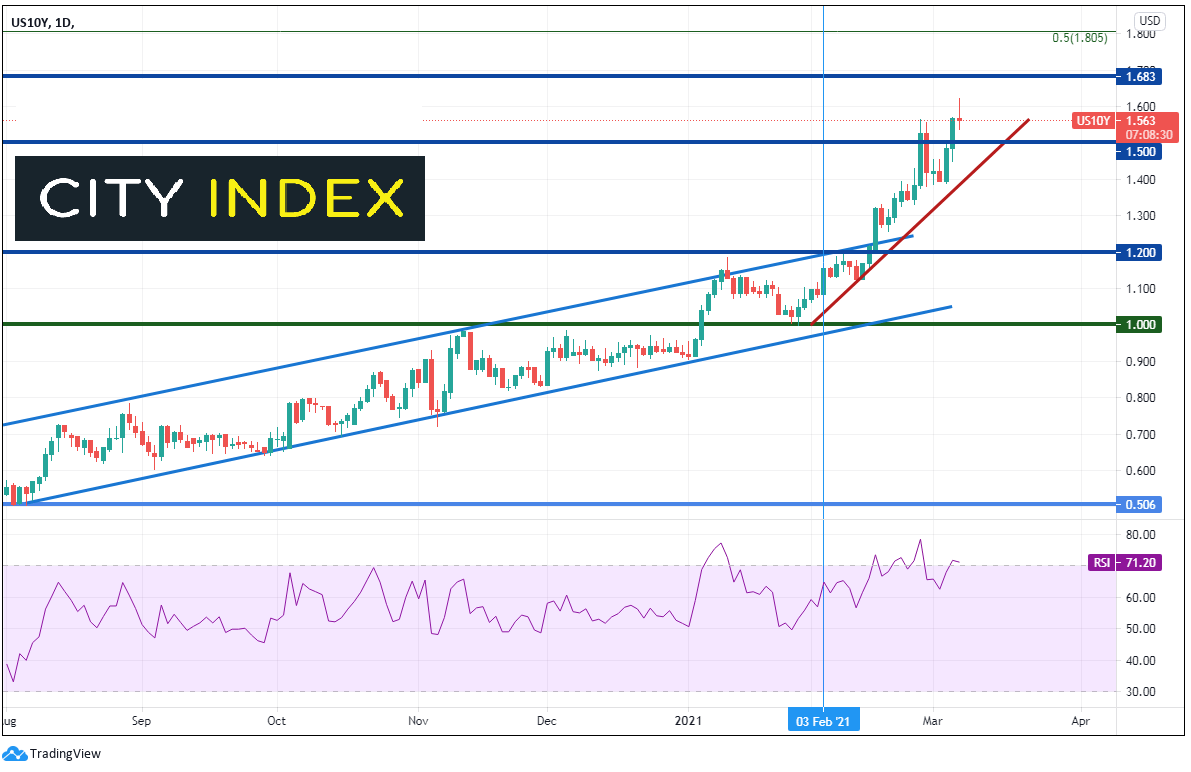
Source: Tradingview, City Index
The US Dollar has been on fire lately. On the release today, the US Dollar Index spiked to horizontal resistance from November 2020 and the 61.8% Fibonacci retracement level from the November 4th highs to the January 6th lows, near 92.20. Above here, the next meaningful resistance level at this point doesn’t cross until 93.25, where a short-term trendline from earlier in the year confluences with a long-term upward sloping trendline from Spring 2011! Support is back at today’s lows at 91.92, which is also near the 50% retracement level of the previously mentioned timeframe and the highs in early February. Below there, resistance is at the March 4th highs near 91.40.
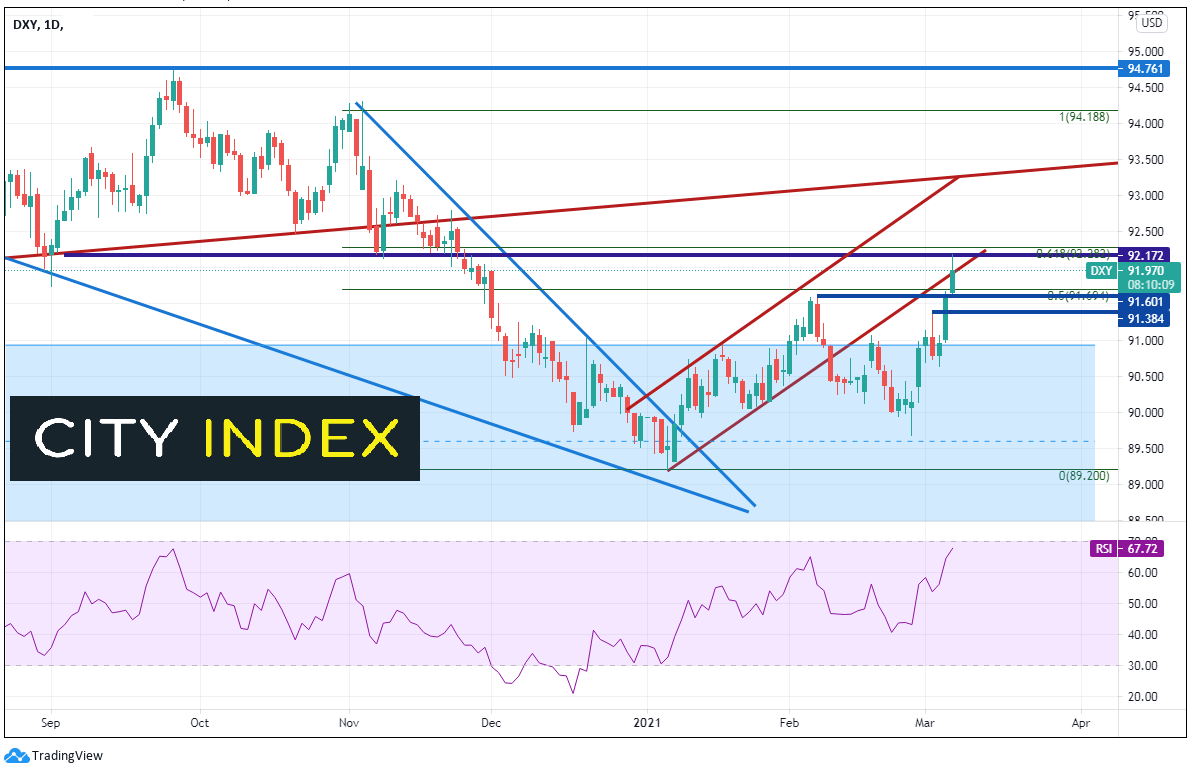
Source: Tradingview, City Index
The market is unsure right now. Do more jobs mean tapering sooner? One print does not equal a trend. Given the Fed’s expectations that inflation job numbers will remain low, don’t expect them to show signs of tapering soon. However, along with focusing on inflation components of economic data, markets will be closely monitoring the jobs components as well!
Learn more about forex trading opportunities.
Latest market news
Yesterday 01:23 PM
Yesterday 06:01 AM
April 18, 2024 11:27 PM
April 18, 2024 04:46 PM
Latest Bonds articles
April 18, 2024 06:20 AM
April 10, 2024 01:09 AM
March 19, 2024 02:30 AM
March 15, 2024 01:38 AM