Nikkei Will the BOJ come to the rescue
Global equities and crude oil prices have endured another wild session today, with both assets moving more or less in tune with one another. Oil […]
Global equities and crude oil prices have endured another wild session today, with both assets moving more or less in tune with one another. Oil […]
Global equities and crude oil prices have endured another wild session today, with both assets moving more or less in tune with one another. Oil prices have been pushing higher in recent days on speculation about Russia meeting with the OPEC to discuss a possible cut in oil production in an effort to shore up prices. Today, both Brent and WTI prices surged higher after Russia appeared to confirm the news. As my colleague James Chen reported earlier, the Russian oil minister was quoted as saying that Saudi Arabia has proposed a 5% reduction in output by each oil-producing nation, with the deal to be discussed in a meeting among oil and energy ministers of both the OPEC and non-OPEC. Brent spiked to $35.80 and WTI to $34.80. The rally then lost momentum after bullish traders took profit and as another report contradicted the earlier one. Even if there is truth in the matter, it remains to be seen if the deal will actually happen. For a start, Iran will oppose any cuts to its production, having just had its sanctions lifted. Will Saudi and Russia be willing to concede market share to Iran? I doubt it. US share producers will also be happy if Russia and the OPEC did actually cut production; they will simply fill the gap. So, there are serious question marks about this potential deal. But if the deal were to be made, it would most likely provide oil prices only a short term boost. For a longer-lasting stability in the oil market, we will need to see a significant rise in demand growth and/or a meaningful drop in US oil production. If the OPEC and Russia were to help support oil prices, why would US oil companies stop production?
In addition to the volatility in the oil market, equity investors are growing worried about the health of the global economy which seems to deteriorating judging by the latest macro pointers. Investors are concerned that stocks could fall further if the major central banks do not significantly increase QE or intervene in other non-conventional ways. So far it has only been the People’s Bank of China which has injected billions of dollars into the financial markets in recent weeks. And although the ECB’s QE programme is still on-going, the Fed has already raised interest rates last year. But now the time may have come for the Bank of Japan to increase its bond buying programme, though most analysts do not expect the central bank to announce any changes at this meeting. But the BOJ could surprise. The decision will be made in the early hours of Friday. So, global stocks could potentially rally, at least in the short-term.
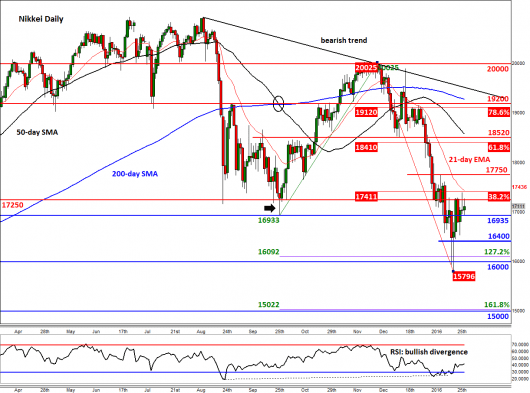
But if the BOJ makes no changes and does not provide a strong hint that a more beefed-up version of QE is forthcoming in the next meeting then stocks could drop. Given this uncertainty, it is not surprising to see the country’s benchmark stock index, the Nikkei, form indecisive price action on its daily chart in recent days. On Wednesday for example, it formed a doji candle which suggests neither the bulls nor the bears are currently in full control. A similar candlestick pattern is being displayed for today’s price action. But digging a little deeper, the underlying trend is still bearish and the recent recovery could just be an oversold bounce – as clearly indicated by the RSI recovering from the ‘oversold’ territory of 30. The index is below its main moving averages and even below the 21-day exponential average. The key levels of resistance to watch include the 38.2% Fibonacci retracement at 17410, prior high at 17750, followed by the 61.8% retracement at 18410. The key levels of support below September’s low of 16935 are 16400 (short-term 61.8% Fib level – not drawn), followed by 16000 – around which the previous low was roughly established. Further lower is 15000, which as well as a psychological level marks the 161.8% Fibonacci extension level of the previous upswing. 