


June 14, 2021 5:47 PM
Nikkei 225 Index: Have we seen this chart before?
The Nikkei 225 Index had been trading in an orderly, ascending channel since the pandemic lows on March 24th 2020 near 15998. On February 16th, the index made a post pandemic high at resistance along the top trendline of the ascending channel near 30724. Often when price tests resistance on one side of a channel, it will move to test the other side of the channel (hence, this is how a channel is formed). For the Nikkei, price began moving lower and broke through the bottom trendline on May 11th. In doing so, price formed a shorter-term, corrective channel (red).
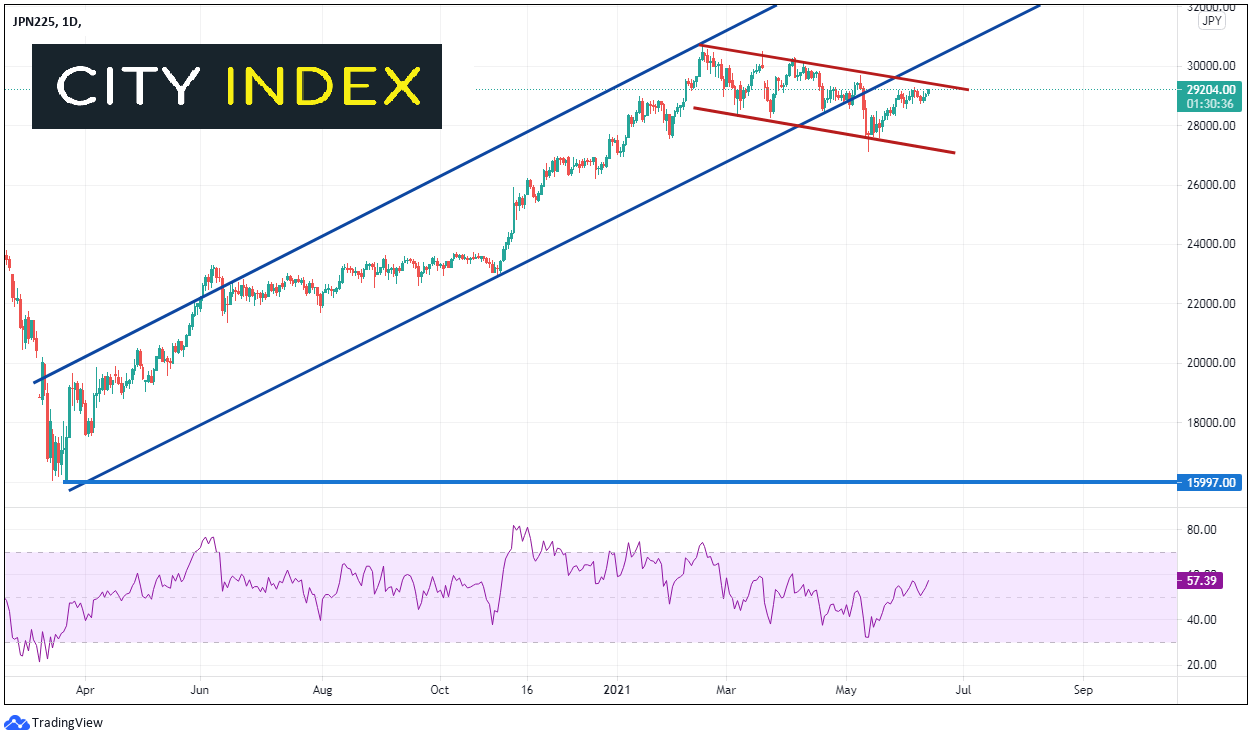
Source: Tradingview, City Index
Now, let’s look at a daily chart of GBP/USD from mid-September 2020. The pair been trading in an orderly, ascending channel since the lows on September 24th 2020 near 1.2667. On February 18th, price made a false breakout above the channel and put in a pos pandemic high near 1.4241. GBP/USD pulled back inside the channel on February 26th. Often when price tests resistance on one side of a channel, (or in this case, price has a false breakout), it will move to test the other side of a channel. For GBP/USD, price began moving lower and broke through the bottom trendline on April 29th. In doing so, price formed a short-term corrective channel (red).
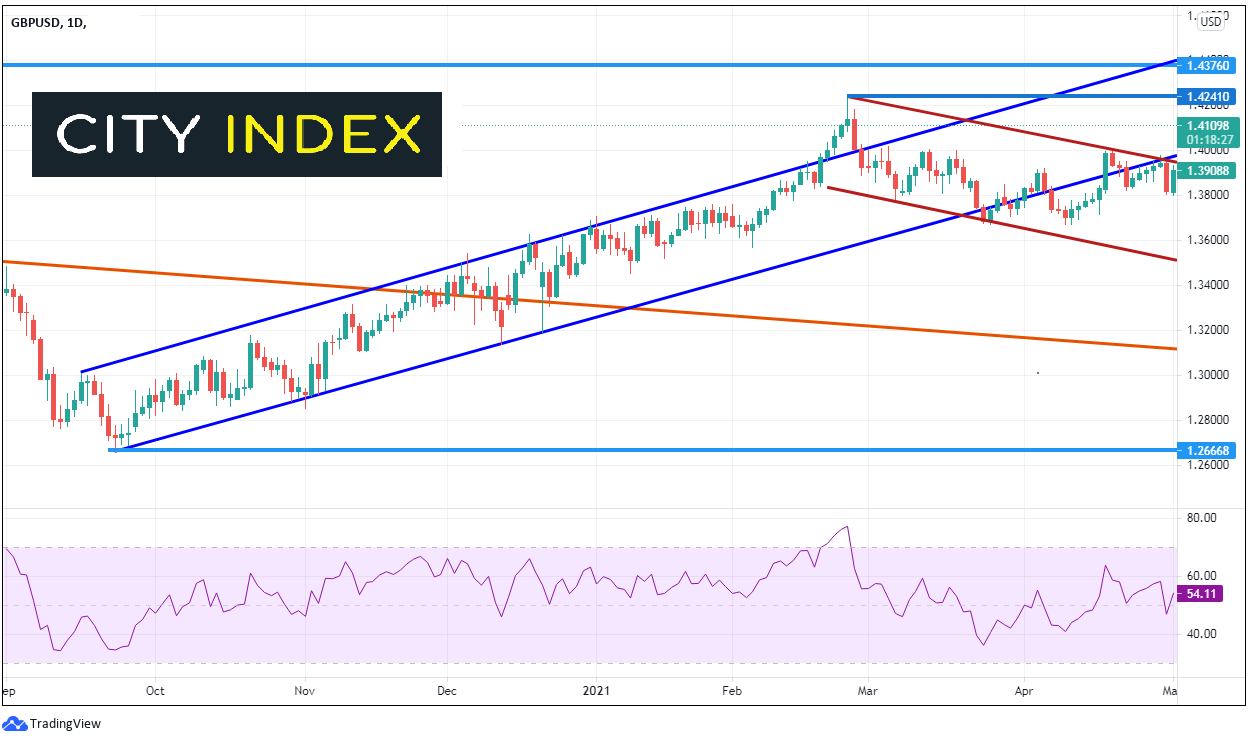
Source: Tradingview, City Index
What happened next? On a 240-minute timeframe we can see that GBP/USD broke out of the corrective channel on May 7th near 1.3920, in the same direction as the prior trend (higher). Price tested resistance at the prior highs of 1.4241 (green), however has failed thus far to push through that level.
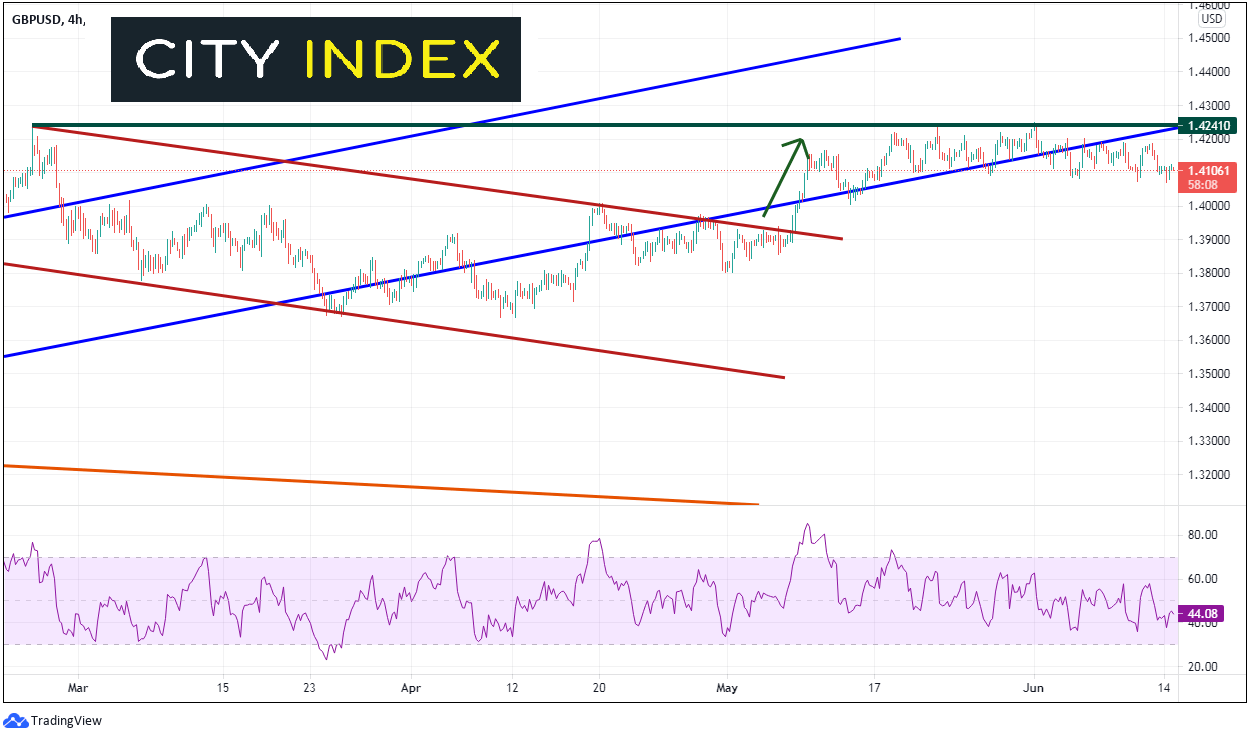
Source: Tradingview, City Index
Could the Nikkei 225 Index act in the same manner us GBP/USD? If so, price may be ready to break out of the corrective channel near 29395, which would be in the same direction as the prior trend (higher). If the Nikkei does move higher, watch for it to test the highs from February 16th at 30724 (green). However, if price does hold at the near-term resistance, look for it to test the bottom trendline of the channel, near 27250.
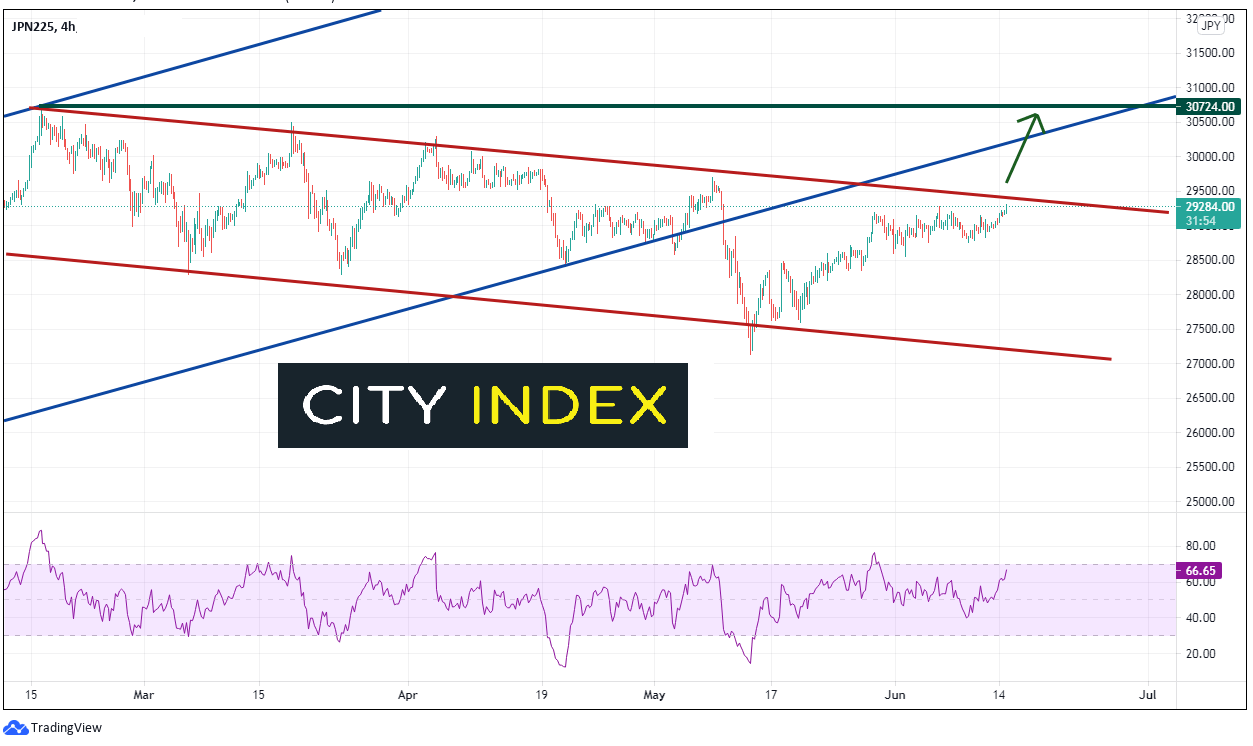
Source: Tradingview, City Index
Technical analysis is about price patterns repeating themselves and prices moving in trends, with corrective waves within the trends. If the Nikkei 225 is going to move higher, it may look like the recent price action in GBP/USD!
Note that both the FOMC and the BOJ both meet later this week. The results of either meeting could cause volatility in stock market indices, including the Nikkei 225. See our complete Fed preview here.
Learn more about index trading opportunities.
Latest market news
Latest Indices articles

April 17, 2024 11:00 AM
April 16, 2024 08:00 PM
April 16, 2024 04:54 PM