Nikkei 225 8211 Further upside potential towards 20 080 20 440
Since the bursting of the Japanese asset (property) price bubble in the early 1990s, the Japanese stock market as represented by the widely-cited benchmark Nikkei […]
Since the bursting of the Japanese asset (property) price bubble in the early 1990s, the Japanese stock market as represented by the widely-cited benchmark Nikkei […]
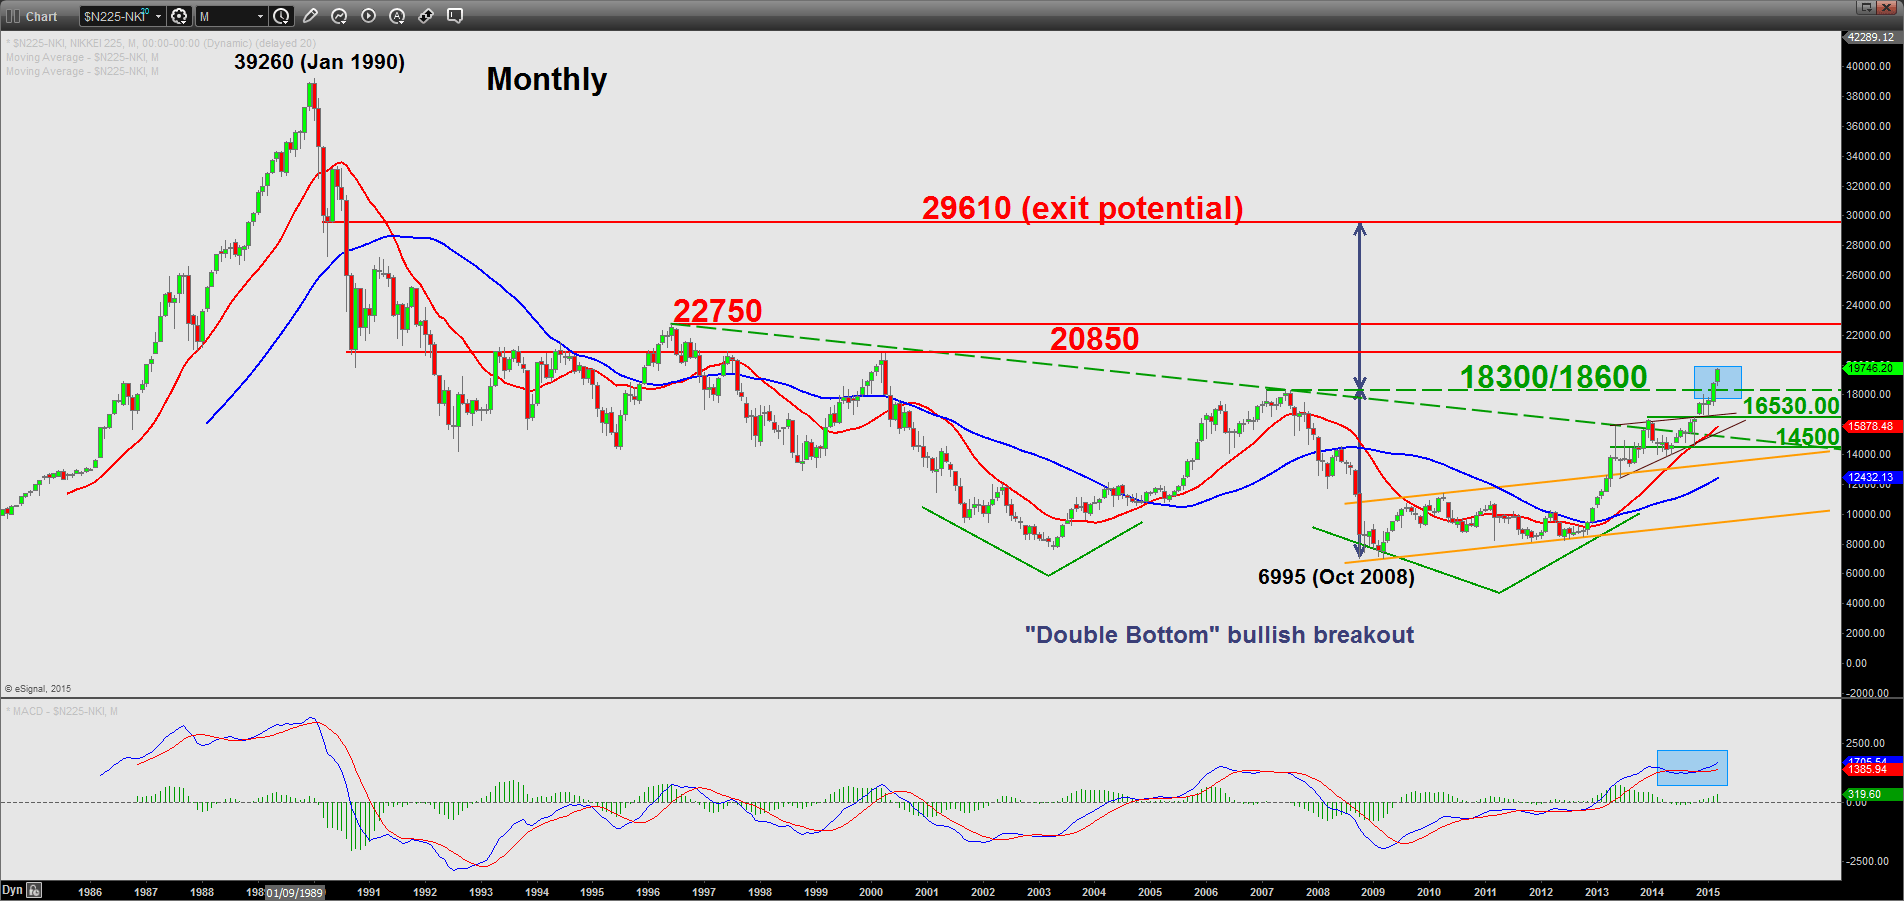
Since the bursting of the Japanese asset (property) price bubble in the early 1990s, the Japanese stock market as represented by the widely-cited benchmark Nikkei 225 has plummeted by a horrendous decline of 80% from a high of 39260 printed on January 1990 to a low of 7606 seen in April 2003.
Even in the previous major bullish trend that occurred from 2003 to 2007 for most emerging and developed markets, Japan was not able to “enjoy the fruits” and underperformed against the rest of the world.
Since the low of 6995 printed in October 2008, the Nikkei 225 has soared by an astonishing 177% to record a high of 18865 seen in February 2015. This remarkable performance is driven primarily by Abenomics.
The big question in all traders’/investors’ minds right now is can this rally be sustainable? Will it falter just like it did after the 2003 to 2007 period?
I will answer this golden question from a technical analysis perspective.
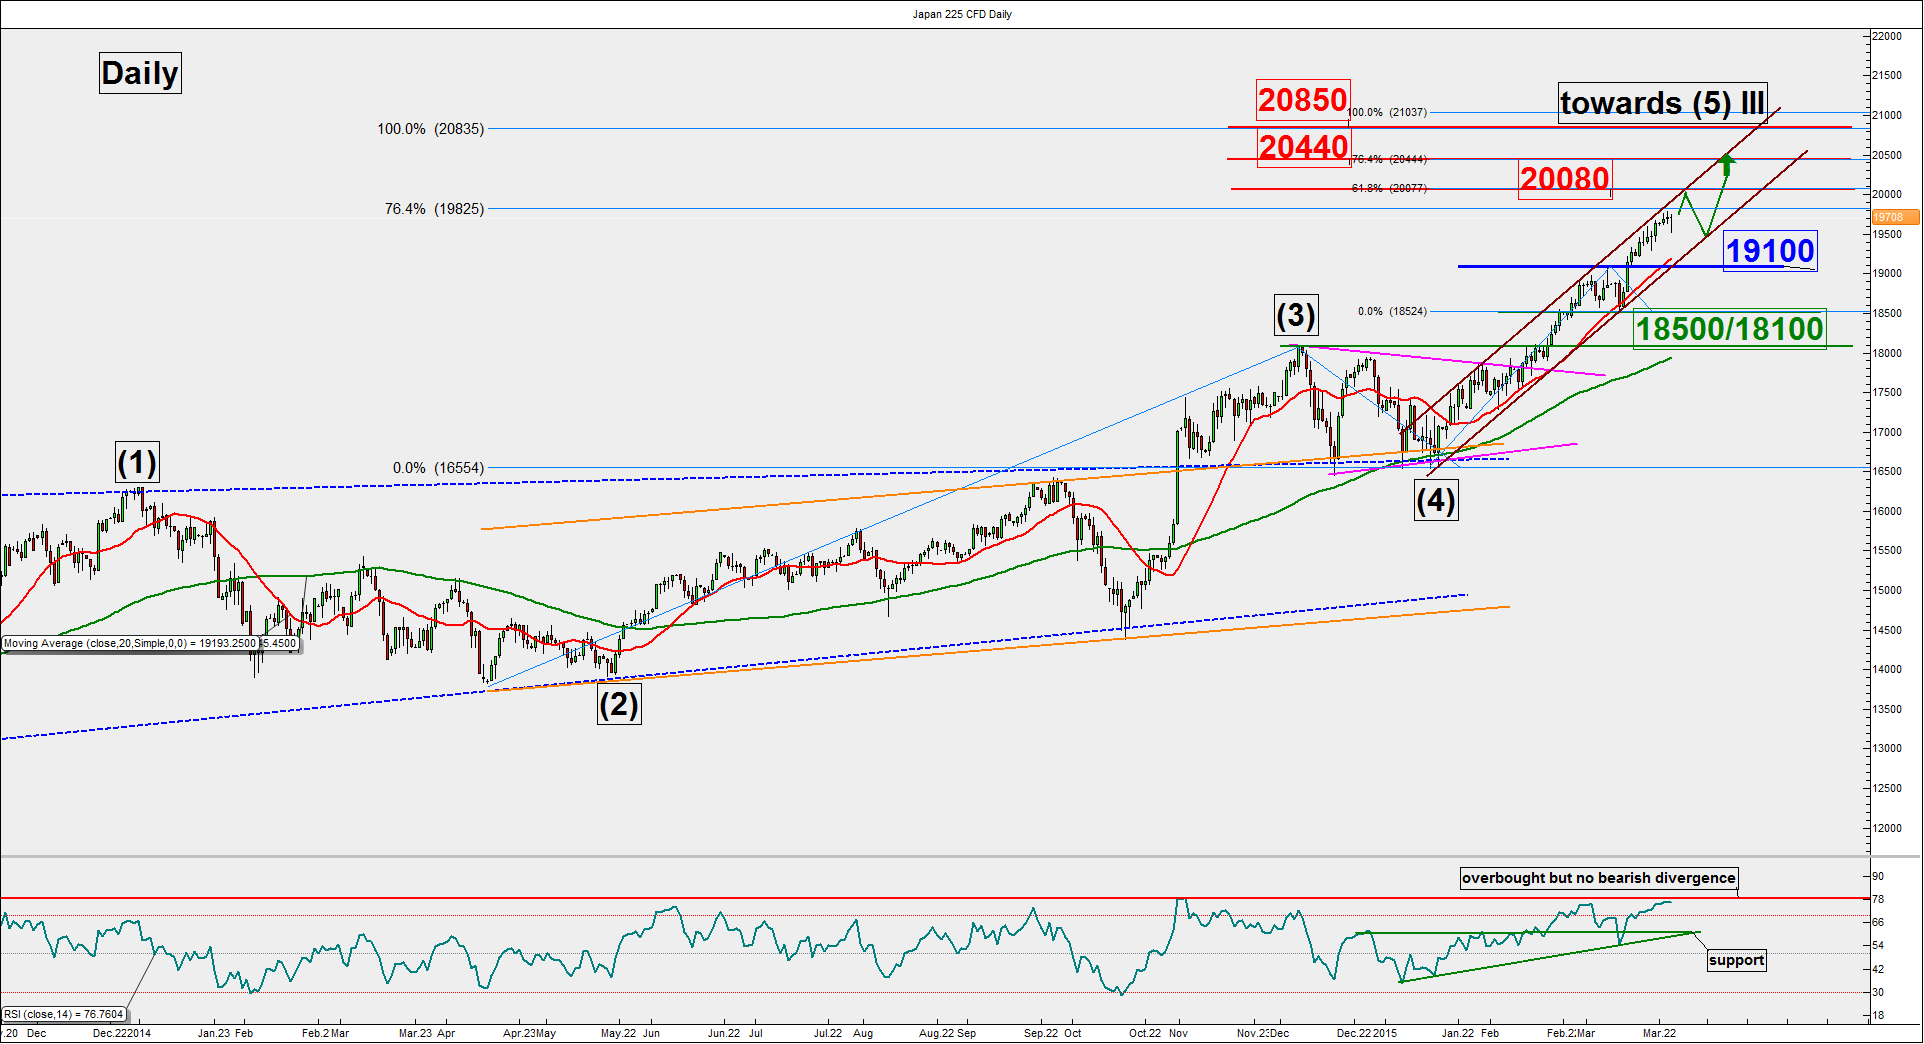
Pivot (key support): 19100
Resistance: 20080 & 20440
Next support: 18500/18100
Technical elements remain positive and as long as the 19100 monthly pivotal support holds, the Nikkei 225 is likely to see a further potential upside movement to target 20080 before 20440.
On the other hand, failure to hold above 19100 may damage the intermediate term bullish trend for a deeper decline towards the next support at 18500/18100 (neckline of the “Double Bottom” bullish breakout).
Both charts are from Advantage Trader & eSignal
