NFP preview USDJPY for USD bulls AUDUSD for USD bears
The February non-farm payrolls report will be released today at 13:30 GMT (8:30 EST) with expectations centred on a headline print of 195 thousand jobs […]
The February non-farm payrolls report will be released today at 13:30 GMT (8:30 EST) with expectations centred on a headline print of 195 thousand jobs […]
The February non-farm payrolls report will be released today at 13:30 GMT (8:30 EST) with expectations centred on a headline print of 195 thousand jobs gained after last month’s somewhat disappointing 151 thousand reading. The employment rate is expected to have remained unchanged at an 8-year low of 4.9 per cent. Recent US employment data suggests that the NFP report could actually miss expectations and the dollar is reacting accordingly. The greenback has eased off since mid-week and the selling pressure intensified on Thursday on the back of the ISM services PMI, of which the employment component suggested that hiring at the largest sector of the US economy shrunk last month. Of course, some of the other indicators released earlier in the week showed a different picture, with the ADP for example printing by a solid 214K reading. So this month’s jobs data is really difficult to predict – was it ever easy? Traders should also monitor the quality of jobs and therefore see how the average hourly earnings have evolved. This is especially the case now that the FOMC is increasingly looking for signs of inflation before raising interest rates again. Wages grew by a surprisingly large 0.5 per cent in January and this time they are seen rising another 0.2 per cent. If the dollar were to rebound, wages will need to show a solid improvement, for as long as the NFP also shows a not-too-scary headline figure. But as I mentioned, there is scope for disappointment.
So, among the leading indicators for the NFP,
In terms of market reaction, if the data beats expectations then the dollar would most likely rally, while disappointment could send it tumbling as rate hike expectations are pushed out further. For stocks, it is not so straight forward. On the one hand, improvement in data would boost confidence in the economy, while on the other hand it would potentially put a June rate hike back on the table. So the best outcome for equity markets is if the data does not deviate significantly from expectations.
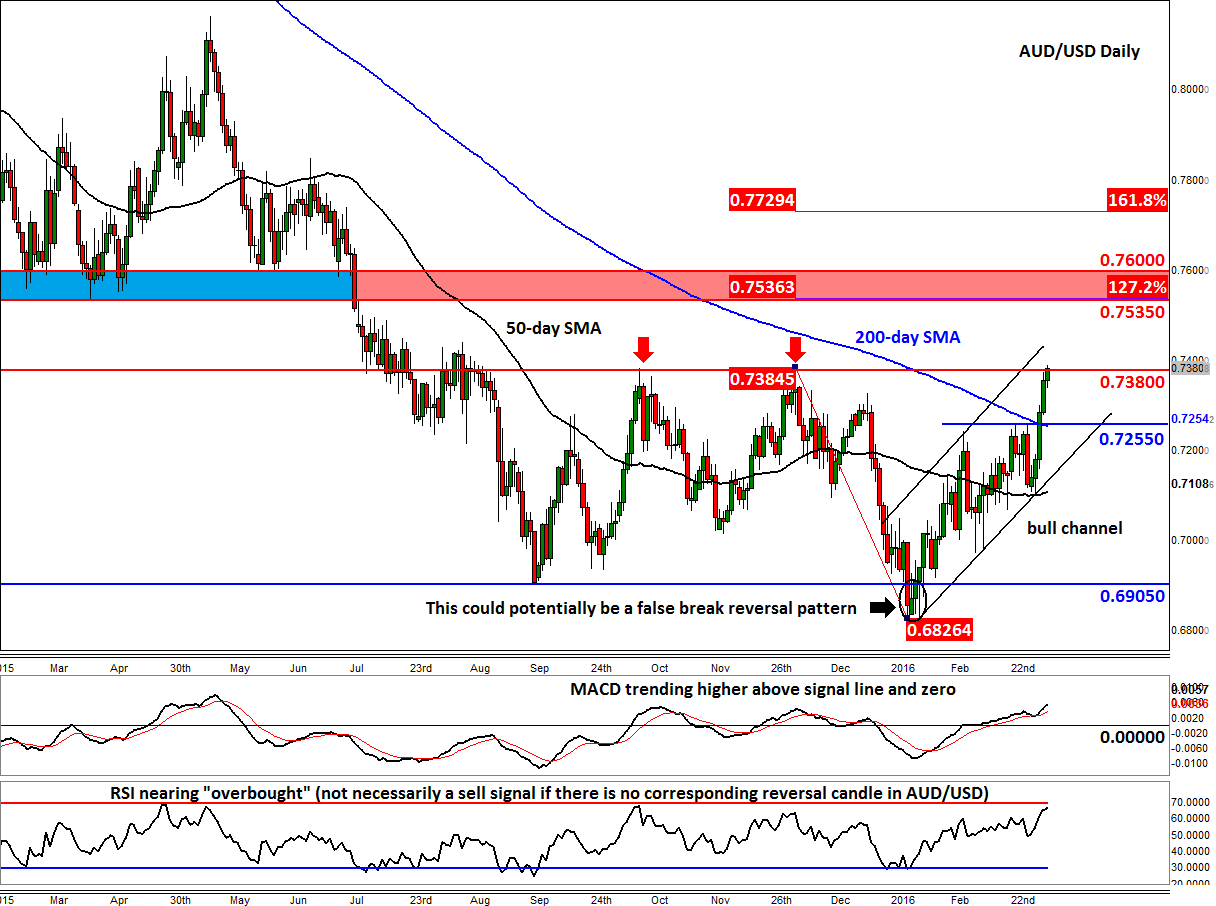
Among the USD pairs, the AUD/USD is catching my eye. The Aussie is testing the top of its recent range at 0.7380 as I go to press. Its impressive run of form is due to the release of stronger Australian data throughout this week, as well as the rebounding commodity prices and the fact the RBA has turned neutral. Thus the AUD/USD may therefore be one to keep an eye on if the US data disappoints expectations.
If the AUD/USD moves decisively above the noted 0.7380 handle on the back of US data or otherwise, then it may then embark on a rally towards the next potential resistance zone between 0.7535 and 0.7600 (see shaded area on the chart). This area was formerly support and the lower end of this range corresponds with the 127.2% Fibonacci extension level of the most recent downswing. In fact the AUD/USD could be headed much higher over time given the reversal signal that was created at the range lows of around 0.6900 back in January i.e. a false breakdown. “From false breaks come fast moves in the opposite direction,” and so it has proved in this case thus far. The momentum indicator MACD is trending higher above zero, which is bullish too. But the RSI is nearing “overbought” level of 0.70, although this in itself is not necessarily a “sell” signal if there is no corresponding reversal candle in AUD/USD daily chart. But failure to climb above the 0.7380 may see the AUD/USD retreat back towards support and the 200-day moving average at 0.7250/55 area before deciding on its next move. This bullish setup would become invalid if the AUD/USD breaks out of the rising channel.
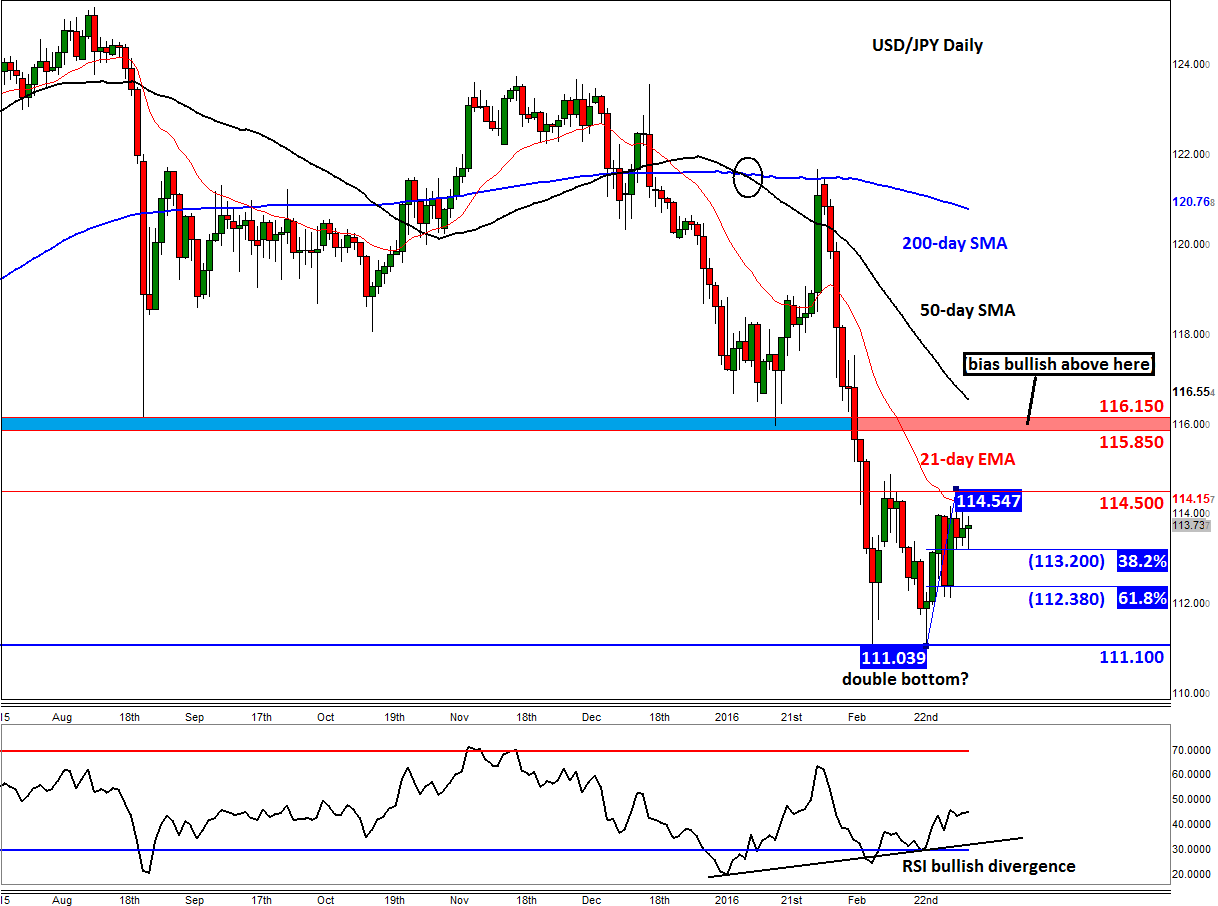
The dollar bulls meanwhile may want to keep an eye on the USD/JPY which may have formed a double bottom at 111.10. A potential break above short-term resistance at 114.50 may pave the way for a rally towards the key resistance zone between 115.85 and 116.15, which was previously a major support zone. The medium-term outlook would turn bullish on a potential rally beyond the 116.15 level and ideally a daily close above it, too. Traders may also want to keep an eye on the short-term Fibonacci levels at 113.20 (38.2%) and 112.38 (61.8%) against the double bottom low. the USD/JPY could bounce from any of these levels (provided the high of 114.55 is not breached beforehand, in which case these Fibonacci levels would become invalid). A break below 111.10 would invalidate this bullish setup and would be a very bearish outcome in my view.