


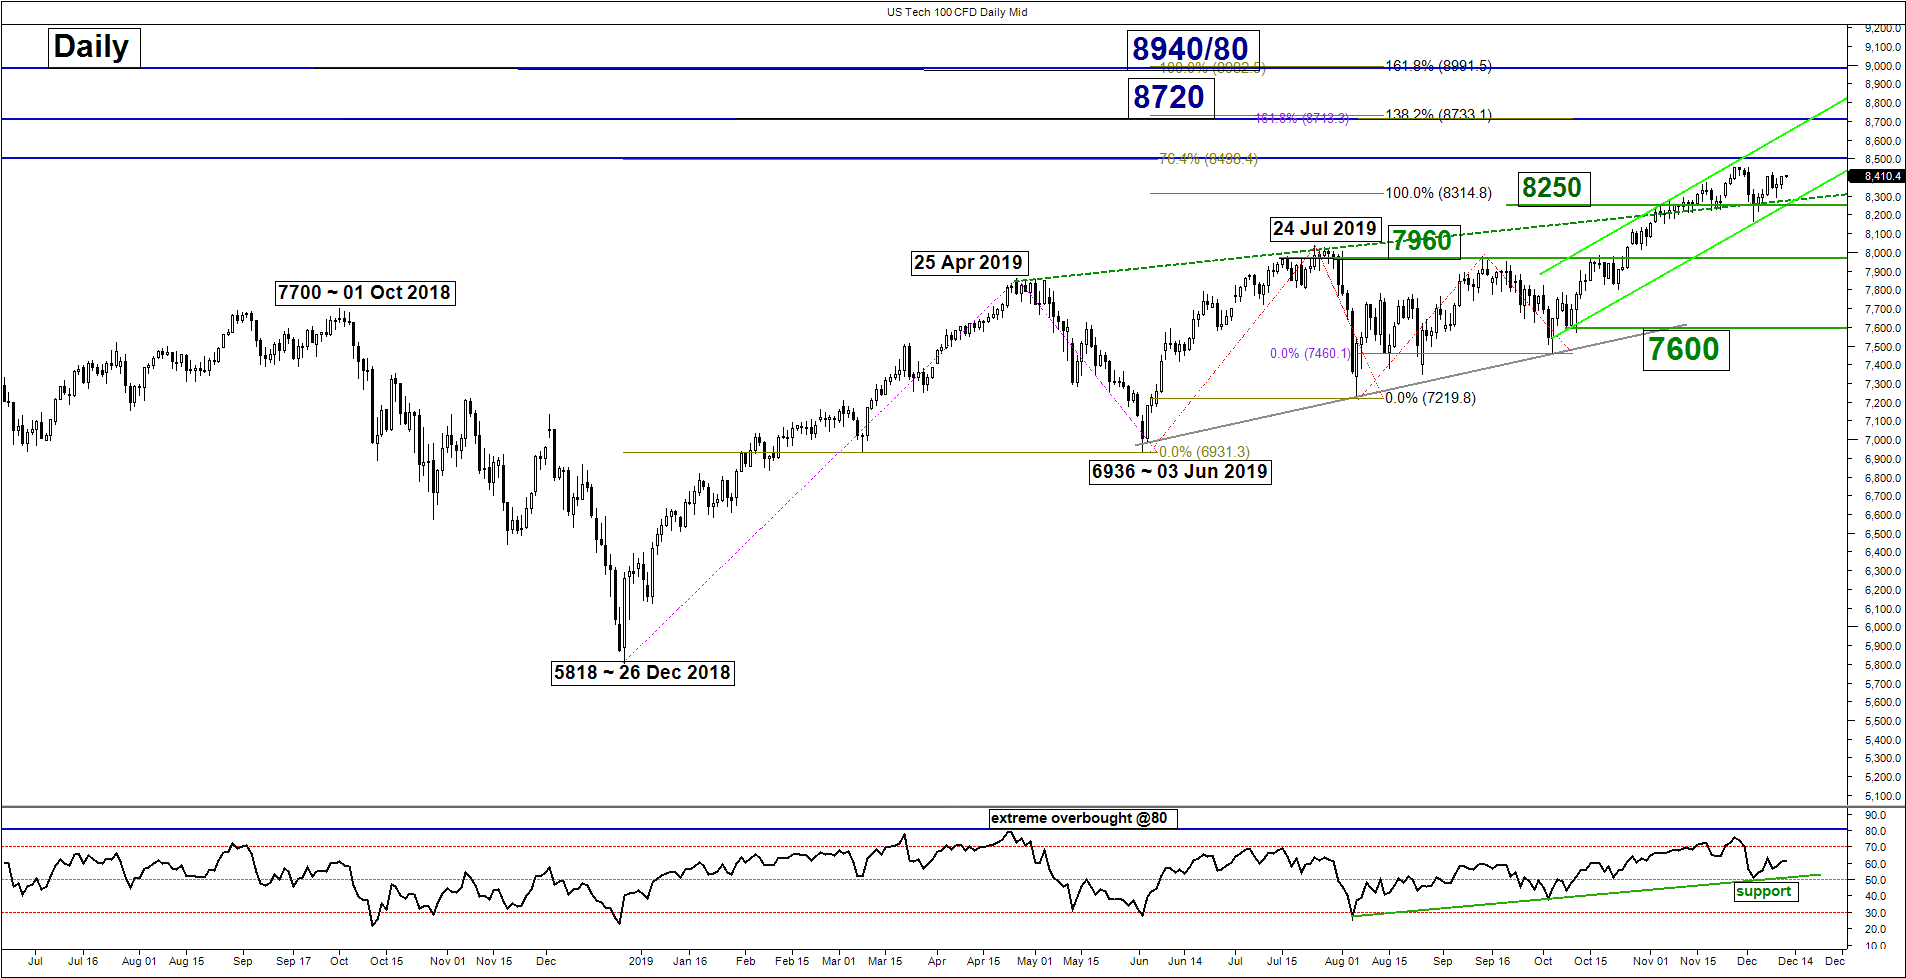
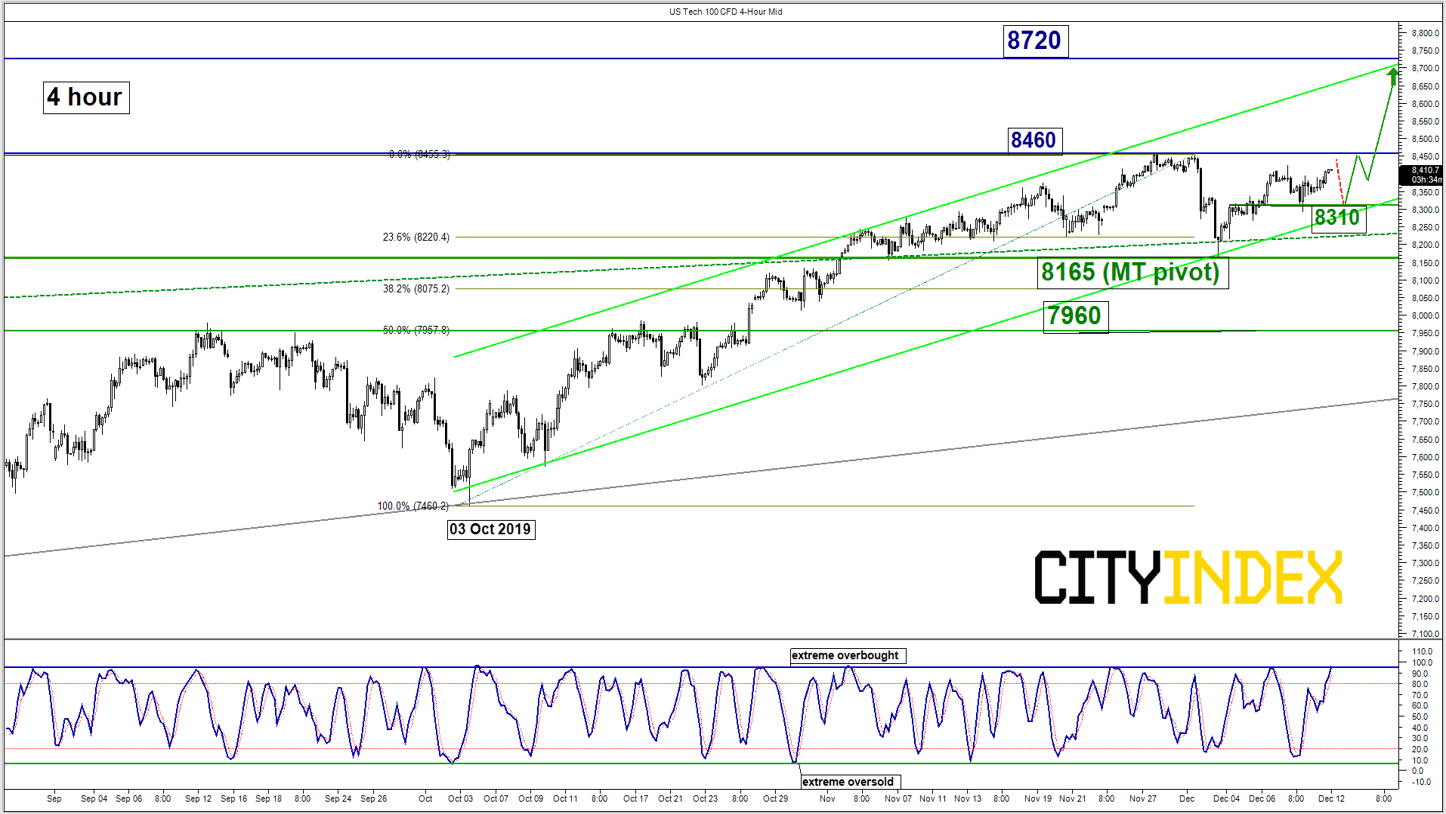
Medium-term technical outlook on Nasdaq 100 (US Tech 100)
click to enlarge charts
Key Levels (1 to 3 weeks)
Intermediate support: 8310
Pivot (key support): 8165
Resistances: 8460 & 8720
Next support: 7960
Directional Bias (1 to 3 weeks)
In our previous report on the US Tech 100 (proxy for Nasdaq 100 futures) dated on 04 Dec 2019, our view was a corrective pull-back first towards 8075/8000 before the another upleg unfolds. The Index had fared much better than our expectation, it printed a low of 8165 on 03 Dec and started to turn higher and almost erased all its losses from the previous slide from the 8454 current all-time high printed on 27 Nov to 03 Dec 2019 low.
Latest price action has reduced the conviction for the corrective decline and we flip to a bullish bias in any dips above 8165 key medium-term pivotal support for retest om 8454/8460 current all-time high area before targeting the next resistance at 8720.
On the other hand, a break with a daily close below 8165 revives the deeper corrective decline scenario to retest 7960 (former medium-term range resistance from 24 Jul/12 Sep 2019 & 50% Fibonacci retracement of the up move from 03 Oct low to 27 Nov 2019 high).
Key elements
- The recent slide seen in the Index from 8454 current all-time high to 8165 low of 03 Dec 2019 has stalled right at pull-back support of the former ascending wedge resistance from 25 Apr 2019 high, lower boundary of a medium-term ascending channel from 03 Oct 2019 low and the 23.6% Fibonacci retracement of the on-going up move from 03 Oct low to 27 Nov 2019 high).
- The daily RSI oscillator has also staged a rebound from a significant corresponding ascending support at the 50 level. These observations suggest a revival of medium-term upside momentum.
- The 8720 resistance is defined by the upper boundary of the medium-term ascending channel from 03 Oct 2019 low and a Fibonacci expansion cluster.
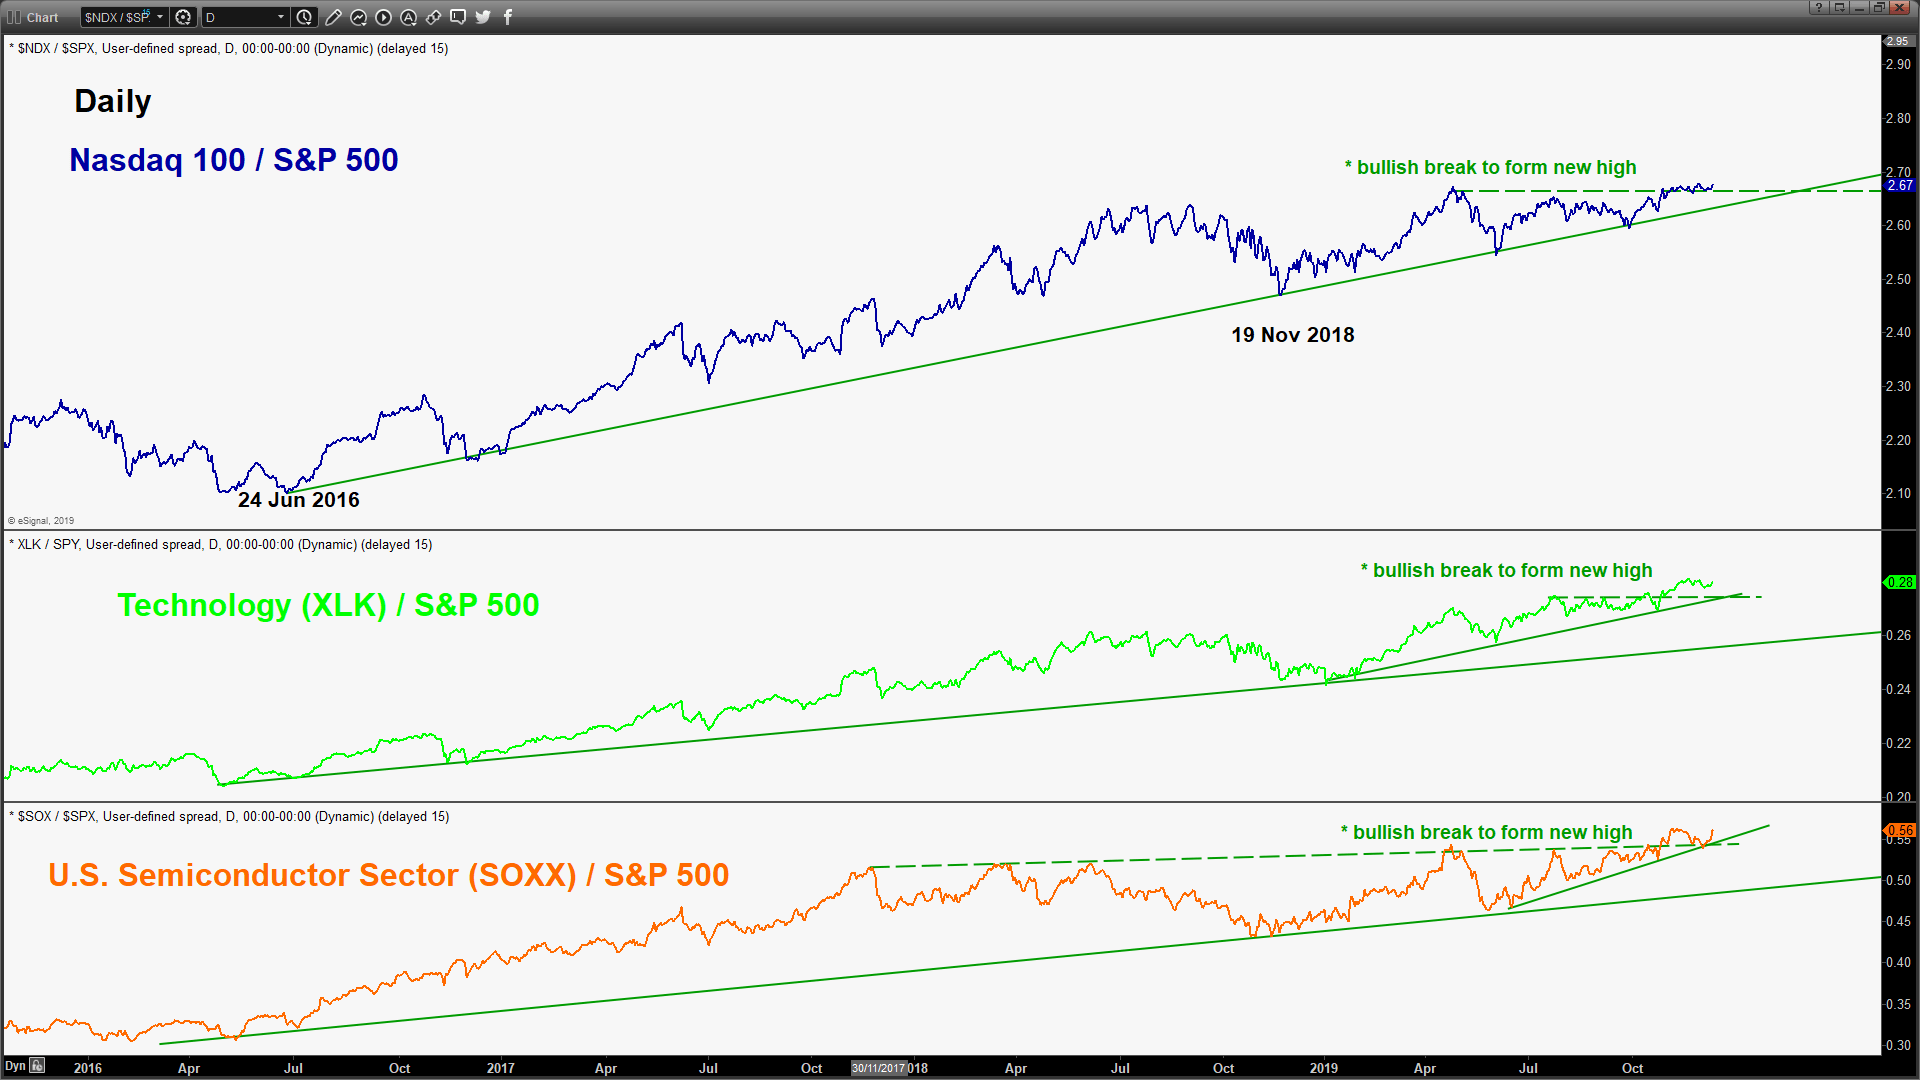
- Relative strength analysis from the ratio charts of Nasdaq 100 and the high beta Technology and Semiconductor sectors against the broader market index (S&P 500) is advocating outperformance of Nasdaq 100 and technology related stocks which has been reinforced by the U.S central bank, the Fed’s desire to keep its key interest rate on hold through 2020 after three cuts to bring down the fed rate to 1.5%-1.75% as indicated from its latest FOMC meeting outcome yesterday.
- A continuation of leadership seen in Nasdaq 100 and technology related stocks is likely to sustain the on-going medium-term uptrend of the U.S. stock market.
Charts are from City Index Advantage TraderPro & eSignal
Latest market news
Today 11:14 AM
Today 08:28 AM
Yesterday 03:30 PM
Yesterday 01:23 PM
Latest Indices articles
Yesterday 03:30 PM
April 18, 2024 04:46 PM
April 17, 2024 11:00 AM
April 16, 2024 08:00 PM