


Short-term technical outlook on US Tech 100/Nasdaq 100
click to enlarge charts
Key Levels (1 to 3 days)
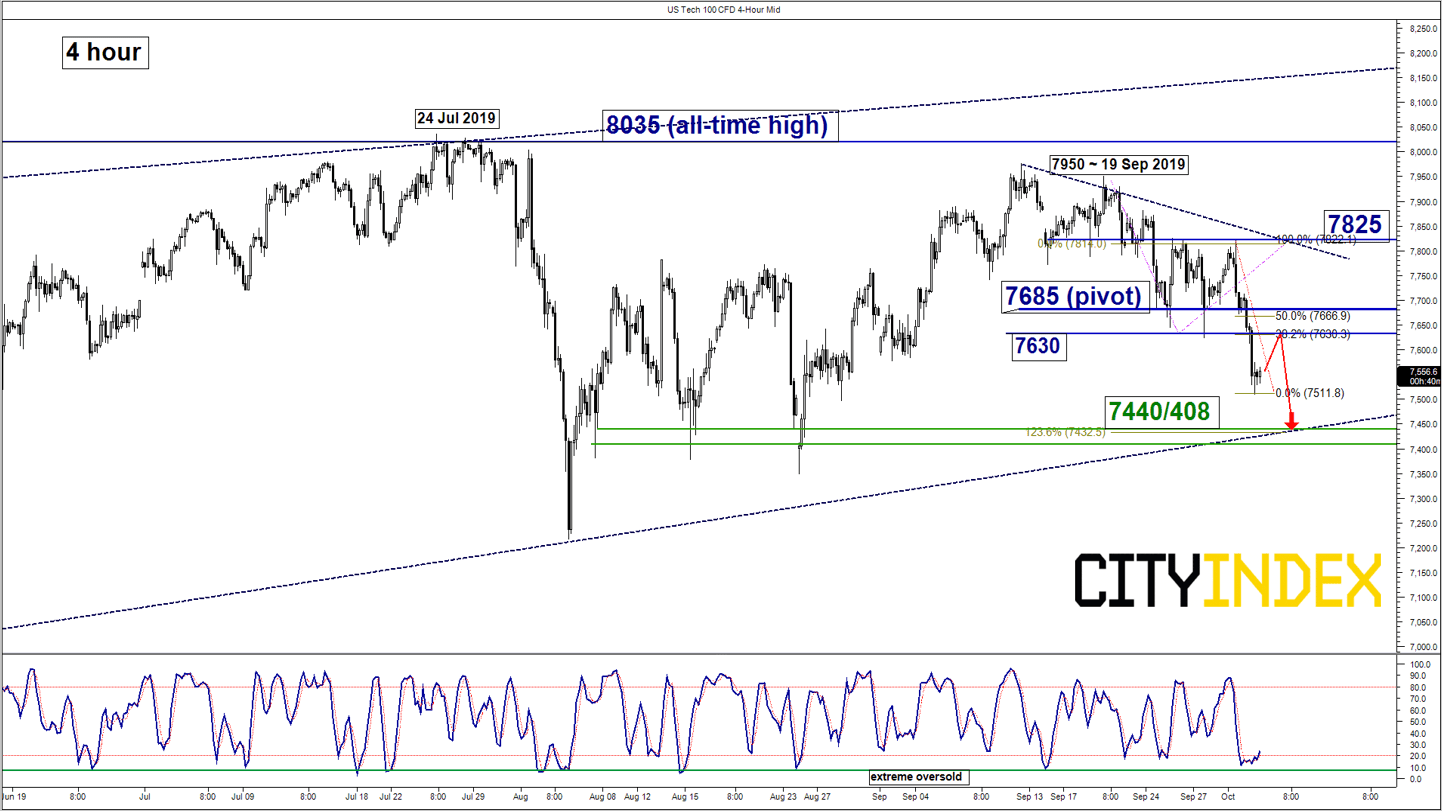
Immediate resistance: 7630
Pivot (key resistance): 7685
Support: 7440/408
Next resistance: 7825
Directional Bias (1 to 3 days)
The US Tech 100 Index (proxy for the Nasdaq 100 futures) may see a bounce first towards 7630 with a maximum limit set at the 7685 pivotal resistance before another potential downleg materialises to test the key support area at 7440/408.
However, a clearance with an hourly close above 7685 invalidates the bearish scenario for a further corrective rebound towards the next resistance at 7825 (also the minor descending trendline from 12 Sep 2019 high).
Key elements
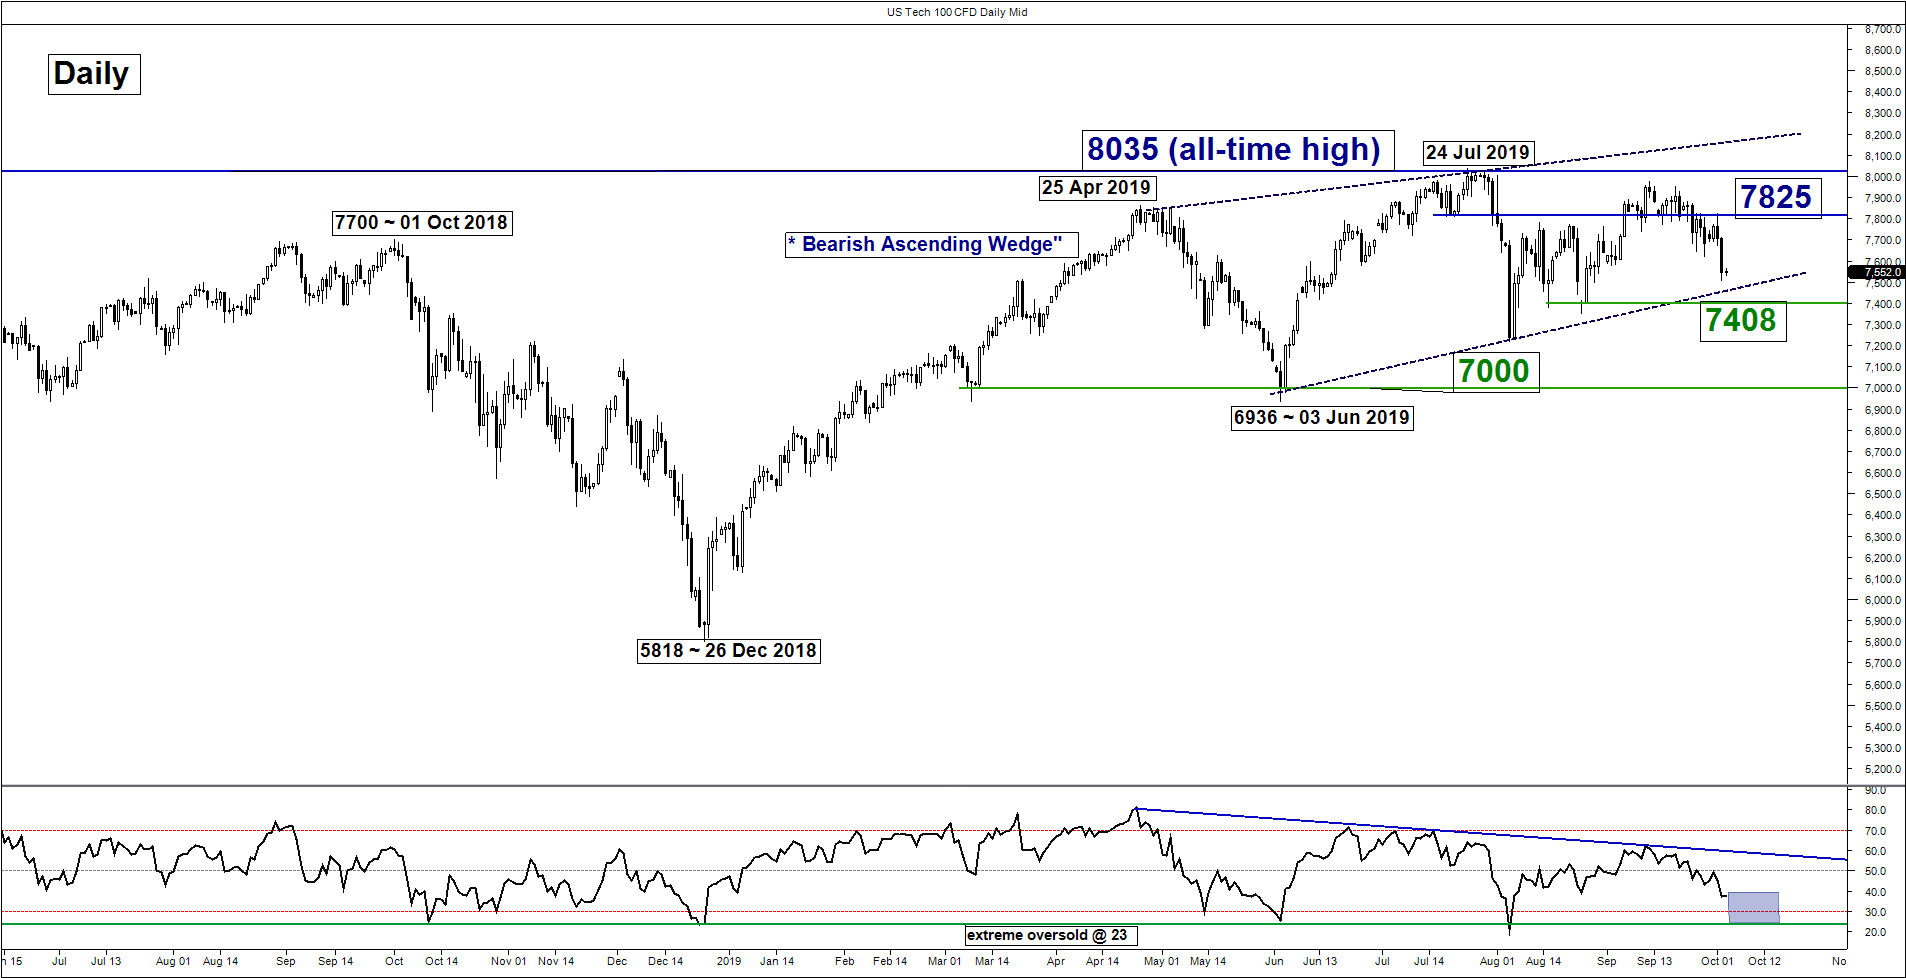
- The daily RSI oscillator of the US Tech 100 Index still has further room to manoeuvre to the downside before it reaches an extreme oversold level of 23. This observation suggests medium-term downside momentum remains intact.
- The key support area of 7440/408 is defined by the lower boundary of a bearish “Ascending Wedge” configuration in place since 03 Jun 2019, the minor range support from 07 Aug/25 Aug 2019 and a Fibonacci retracement/expansion cluster.
- The shorter-term Stochastic oscillator has started to inch up from its oversold region which suggests the decline in price action seen in the past two days is overstretched where the probability of rebound increases at this juncture.
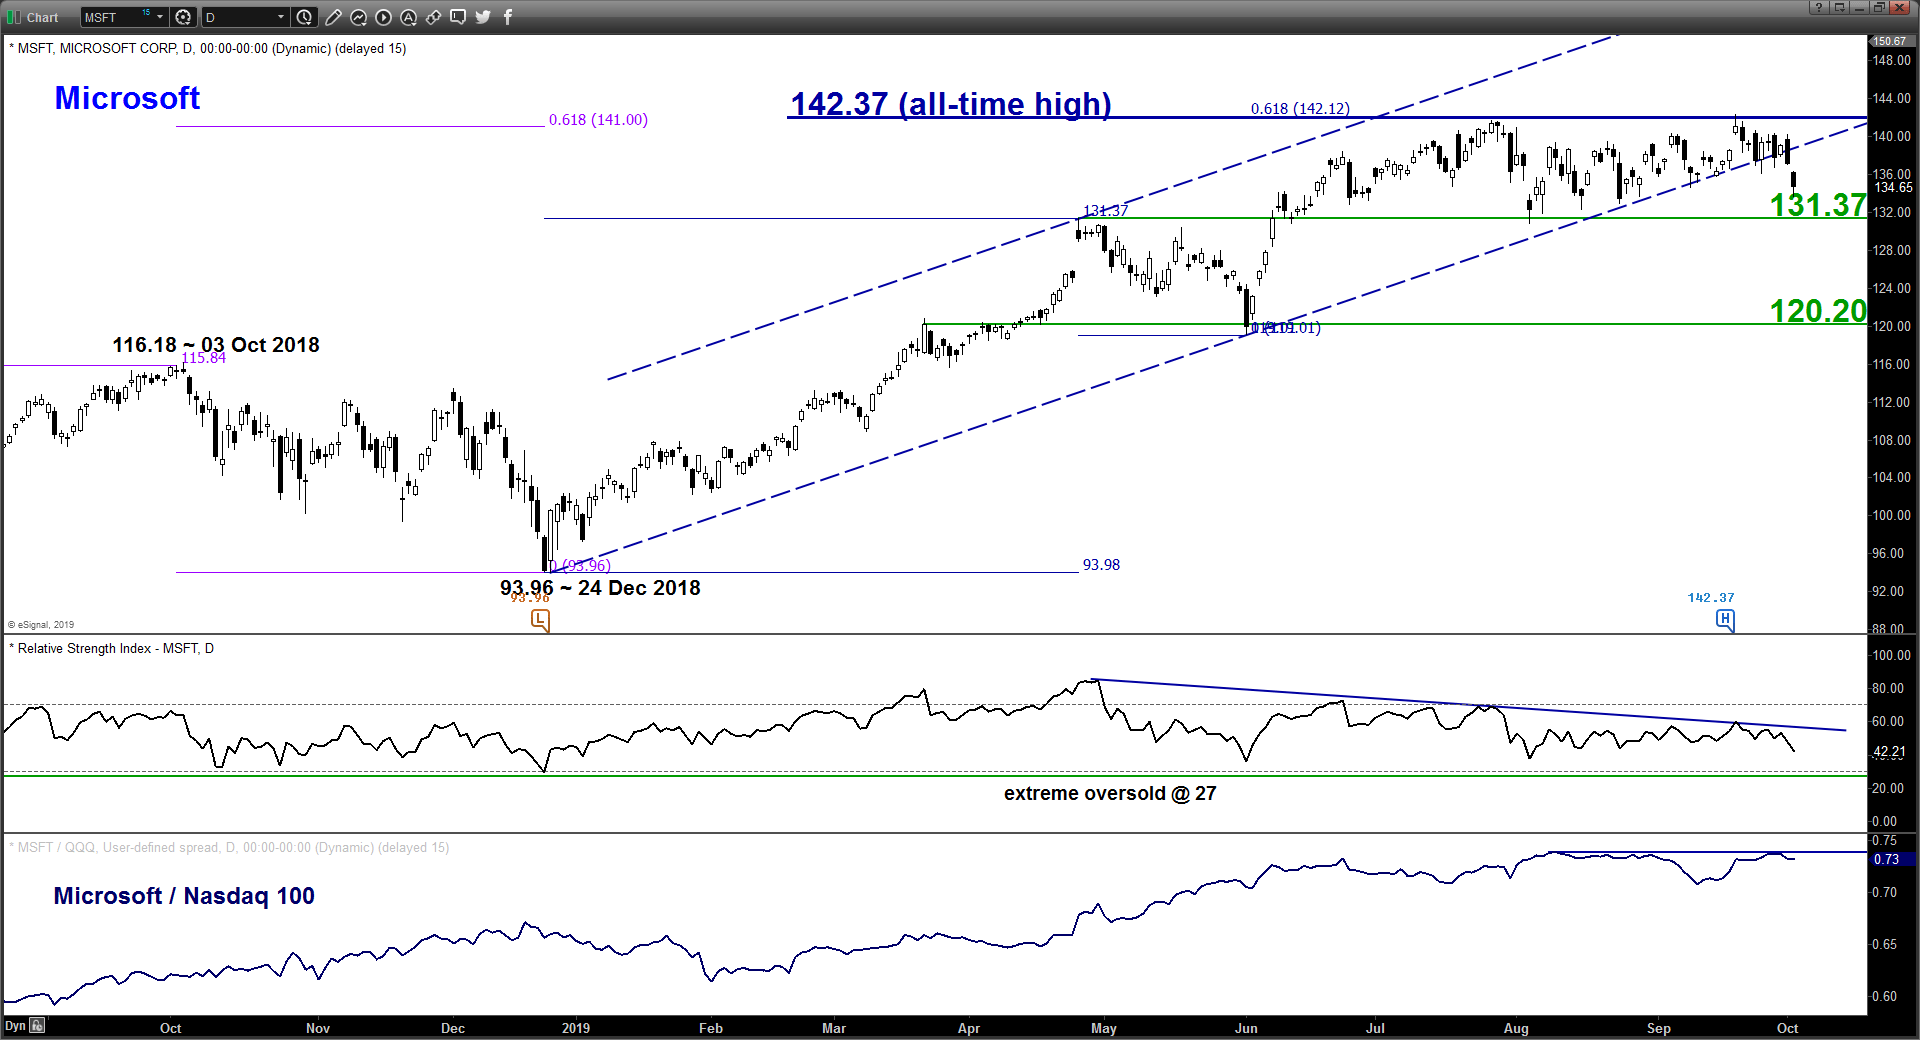
- Microsoft, the biggest weightage component stock in the Nasdaq 100 has started to exhibit bearish elements. Its price action has staged a bearish breakdown below the ascending channel support from 24 Dec 2018 low. In addition, relative strength analysis on the ratio chart of Microsoft over Nasdaq 100 suggests further potential underperformance in Microsoft against the its benchmark Nasdaq 100 index. Overall, these observations suggest further potential weakness in the Nasdaq 100 over the short to medium-term horizon (1 to 3 weeks).
Charts are from City Index Advantage TraderPro & eSignal
Latest market news
Yesterday 03:00 PM
Yesterday 01:12 PM
Yesterday 11:14 AM
Yesterday 08:28 AM
April 24, 2024 03:30 PM
Latest Indices articles

Yesterday 03:00 PM
April 24, 2024 03:30 PM
April 18, 2024 04:46 PM