


Medium-term technical outlook on Nasdaq 100 (US Tech 100)
click to enlarge charts
Key Levels (1 to 3 weeks)
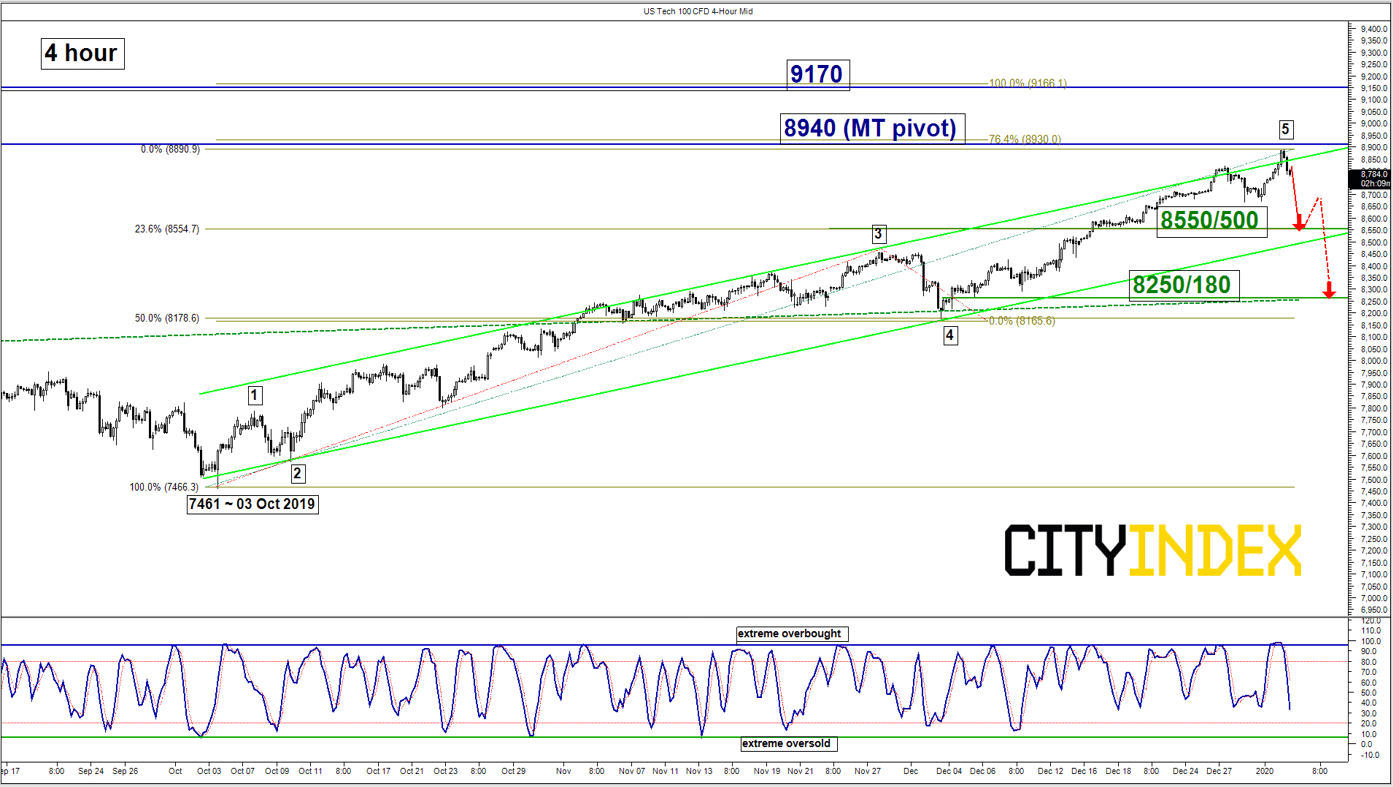
Pivot (key resistance): 8940
Supports: 8550/500 & 8250/180
Next resistance: 9170
Directional Bias (1 to 3 weeks)
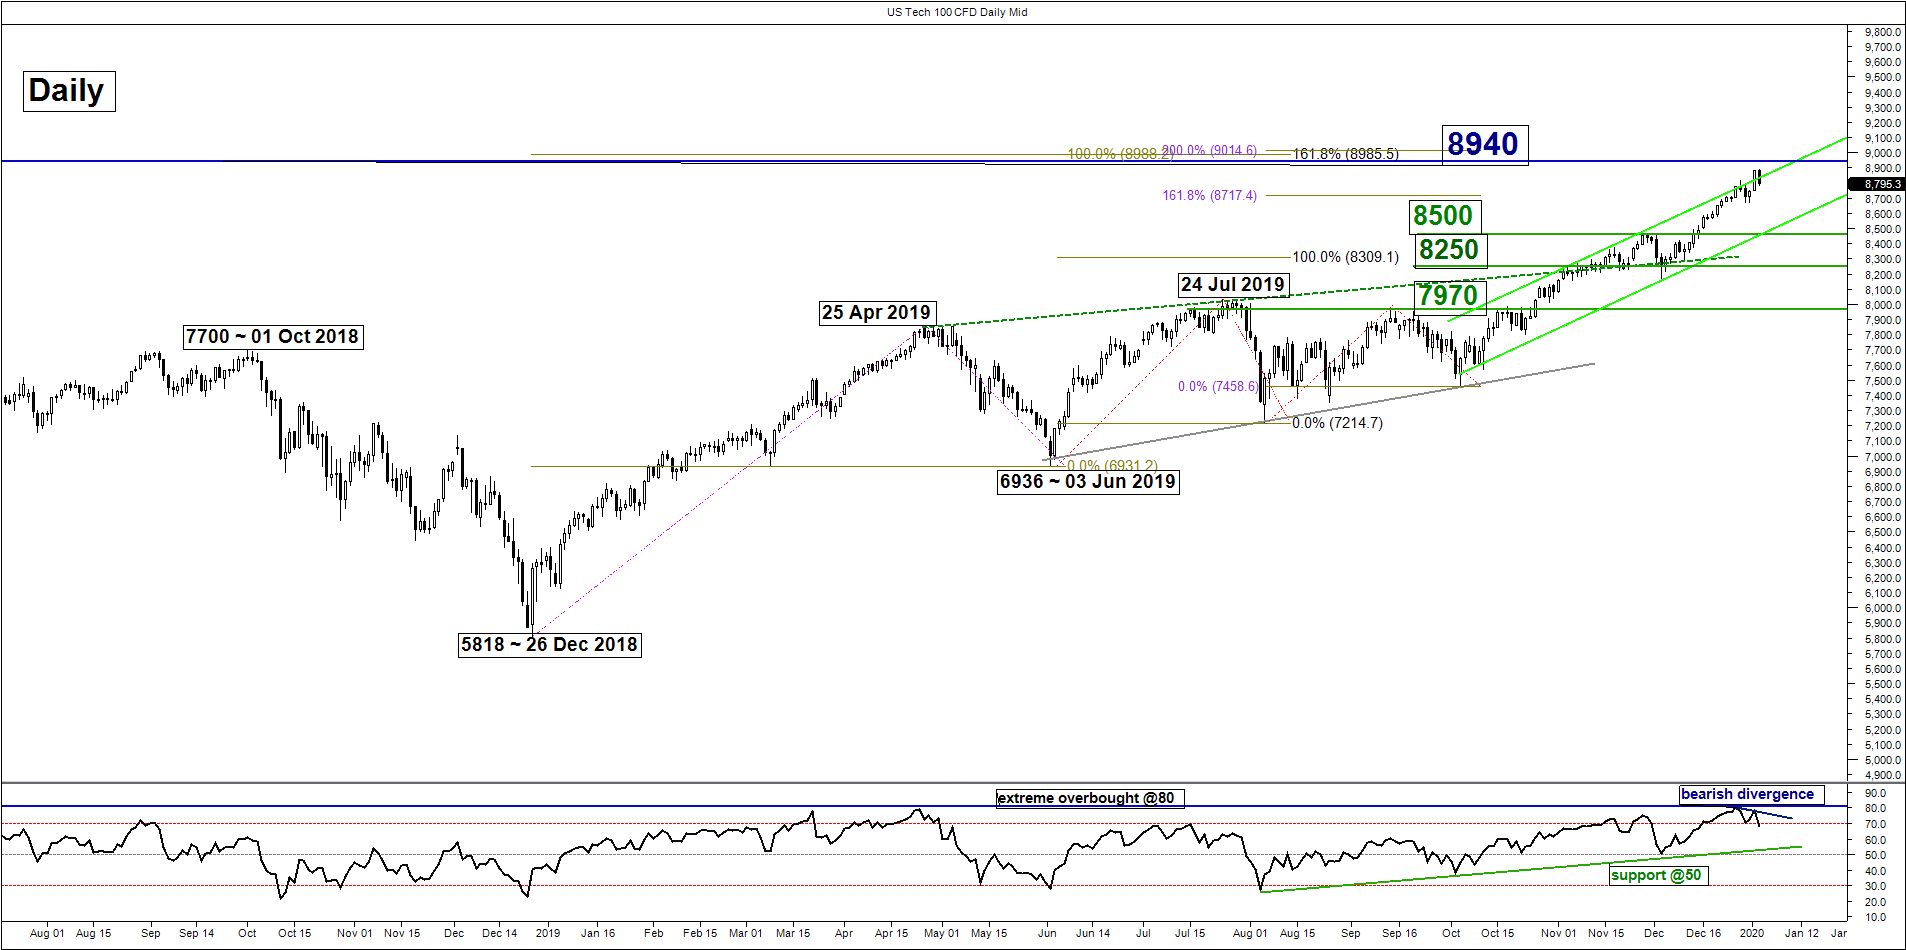
In our previous report on the US Tech 100 (proxy for Nasdaq 100 futures) dated on 12 Dec 2019 (click here for a recap), the Index has rallied as expected and met the upside target/resistance of 8720 (printed a current intraday fresh all-time of 8889 in today’s Asia session). Interestingly, the latest push up is just a whisker away from a major resistance of 8940.
Flip to a bearish bias below 8940 pivotal resistance for a potential multi-week corrective decline sequence to target the next supports at 8550/500 and 8250/180 within a major uptrend.
On the other hand, a clearance with a daily close above 8940 invalidates the bearish scenario for the “high-flying Index” to reinsert its bullish tone for another push up to target 9170 (1.00 Fibonacci expansion of up move from 03 Oct 2019 low to 28 Nov 2019 high projected from 03 Dec 2019 low).
Key elements
- The recent rally from 03 Dec 2019 swing low of 8165 has reached the upper boundary of the ascending channel in place since 03 Oct 2019 and confluences with a major resistance of 8940 that is defined by a Fibonacci expansion cluster.
- The daily RSI oscillator has started to shape a bearish divergence signal after it has met an extreme overbought level of 80. This observation suggests the medium-term upside momentum of price action has abated.
- Elliot Wave/fractal analysis has indicated that the recent medium-term upleg phase from 03 Oct 2019 low of 7461 has completed a 5-wave impulsive sequence with a potential end target set at 8930 (0.764 Fibonacci expansion from 03 Oct 2019 low to 28 Nov 2019 high projected from 03 Dec 2019 low). Thus, it may now kick start a corrective decline to retrace the gains of aforementioned medium-term upleg phase.
Charts are from City Index Advantage TraderPro
Latest market news
Yesterday 03:00 PM
Yesterday 01:12 PM
Yesterday 11:14 AM
Yesterday 08:28 AM
April 24, 2024 03:30 PM
Latest Indices articles

Yesterday 03:00 PM
April 24, 2024 03:30 PM
April 18, 2024 04:46 PM