Morrisons gets a head start into an uncertain future
Morrisons rounds off a milestone year, confirming that it’s on a path to a future of sustainable profitability, with significant uncertainties.
Morrisons rounds off a milestone year, confirming that it’s on a path to a future of sustainable profitability, with significant uncertainties.
It is the aspects of that future which are beyond the group’s control that are now investors’ main concern, and these are pressing the group’s shares lower on Thursday, after a year in which the stock outperformed all rivals, rising 55%.
Among the Big 4 UK retailers, Morrisons is no longer the runt of the litter, but it does acknowledge uncertainties ahead that all consumer-facing companies will face, particularly “the impact on imported food prices if sterling stays at lower levels”. The group also nods to pressures from pension fund depreciation and the increasing burden of statutory wage rises.
It is the uneven ramp of suppliers’ input costs linked to the weak pound that threaten to bite the hardest though. These costs must either be passed on to retailers or offset elsewhere. Indeed, the first signs of these pressures appear in Morrisons’ annual earnings and they are one of the few elements of the results that miss market expectations. The group reported an unexpected rise in its cost of sales. Whilst up a slight 1.3% to £15.71bn, the City was expecting cost of revenue to decline by around 8.5%, particularly factoring in Morrisons’ early achievement and surpassing of a £1bn cost savings plan which brought in £393m in 2016. Gross profit at £604m still beat expectations, with a 2.1% improvement on 2016, but the faster than expected creep upwards in sales costs is troubling, nonetheless.
It’s a reminder that patches of untamed territory between input and output costs remain (and probably always will) even excluding, £60m restructuring expenses and despite Morrisons’ operating margin firming by 17 basis points.
The group does however have a number of advantages that will help contain imported and home-produced food price inflation over the short and longer term.
Firstly, its expectation of at least £1.1bn from disposal proceeds, £893m already achieved, a light impairment profile and below-guidance capex, demonstrate the new management team’s tighter adherence to plan. Secondly, the group has now achieved a goal that pre-dates the supermarket crisis years: it is now among the top 3 British food manufacturers. Even so, it is not just passively soaking up price benefits at the margin. Its aim, revealed last month, is to bring on 200 new independent food suppliers, to ‘hedge’ price risks to a degree.
Morrisons also has ‘last mover’ advantage against other major supermarkets with the introduction of a truly state-of-the-art automated ordering system this year (except in clothing) reducing stock and labour hours. It is also eyeing more cost opportunities internally, and in distribution, manufacturing and retail operations.
Underscoring the group’s catch-up with the rest of the large grocery pack, it was able to report cash flow generation ahead of 3-year target at £670m in 2016/17, in line with the group overtaking Sainsbury’s in annual free cash flow (that’s even excluding Sainsbury’s purchase of Home Retail Group.)
Of course, these head starts won’t immunise Morrisons from economic volatility, nor even shield it from the impact of significant competitive innovation by rivals. They do however improve grounds for cautious optimism that Morrisons can trounce its own, admittedly modest, medium-term profit goals, increasing chances that investor expectations will need to be slightly upgraded instead of lowered.
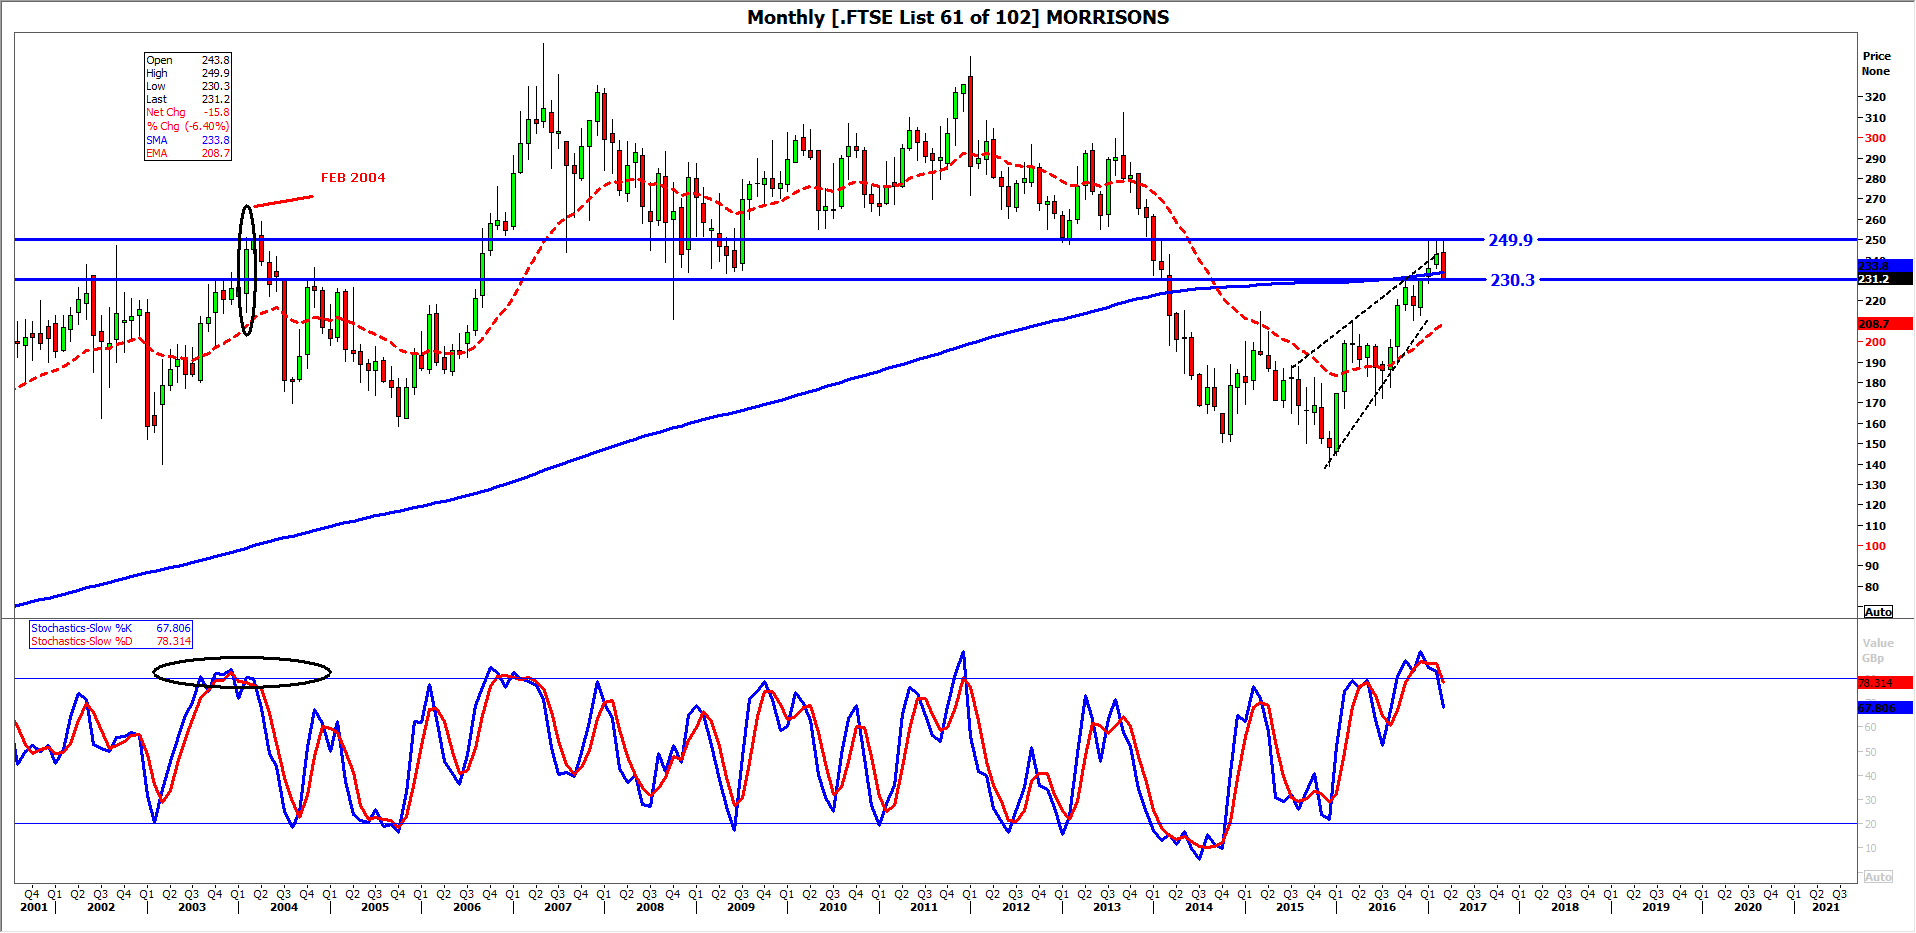
In technical terms, Morrisons’ shares are exhibiting a strong rejection of prices above 250p. Looking at the chart of monthly intervals, it’s clear that the stock has been no higher than 250p for two consecutive months, and may fail to do so for a third time again in March, marking the first monthly decline since November.
The last time this approximate price level presented significant monthly resistance was in February 2004 (see black ellipse to the left of the monthly chart). It’s worth noting that the stock did breach the level a month later, though not sustainably. On that occasion, the shares were on a crest of a wave, momentum-wise (see Slow Stochastic oscillator sub-chart). But waves are ephemeral, and on the current occasion, the oscillator is already selling off. That suggest that even if Morrison manages to overcome the 250p resistance in the fairly near term, the possibility of equally short-lived divergence aside, the stock is set for a period of consolidation.
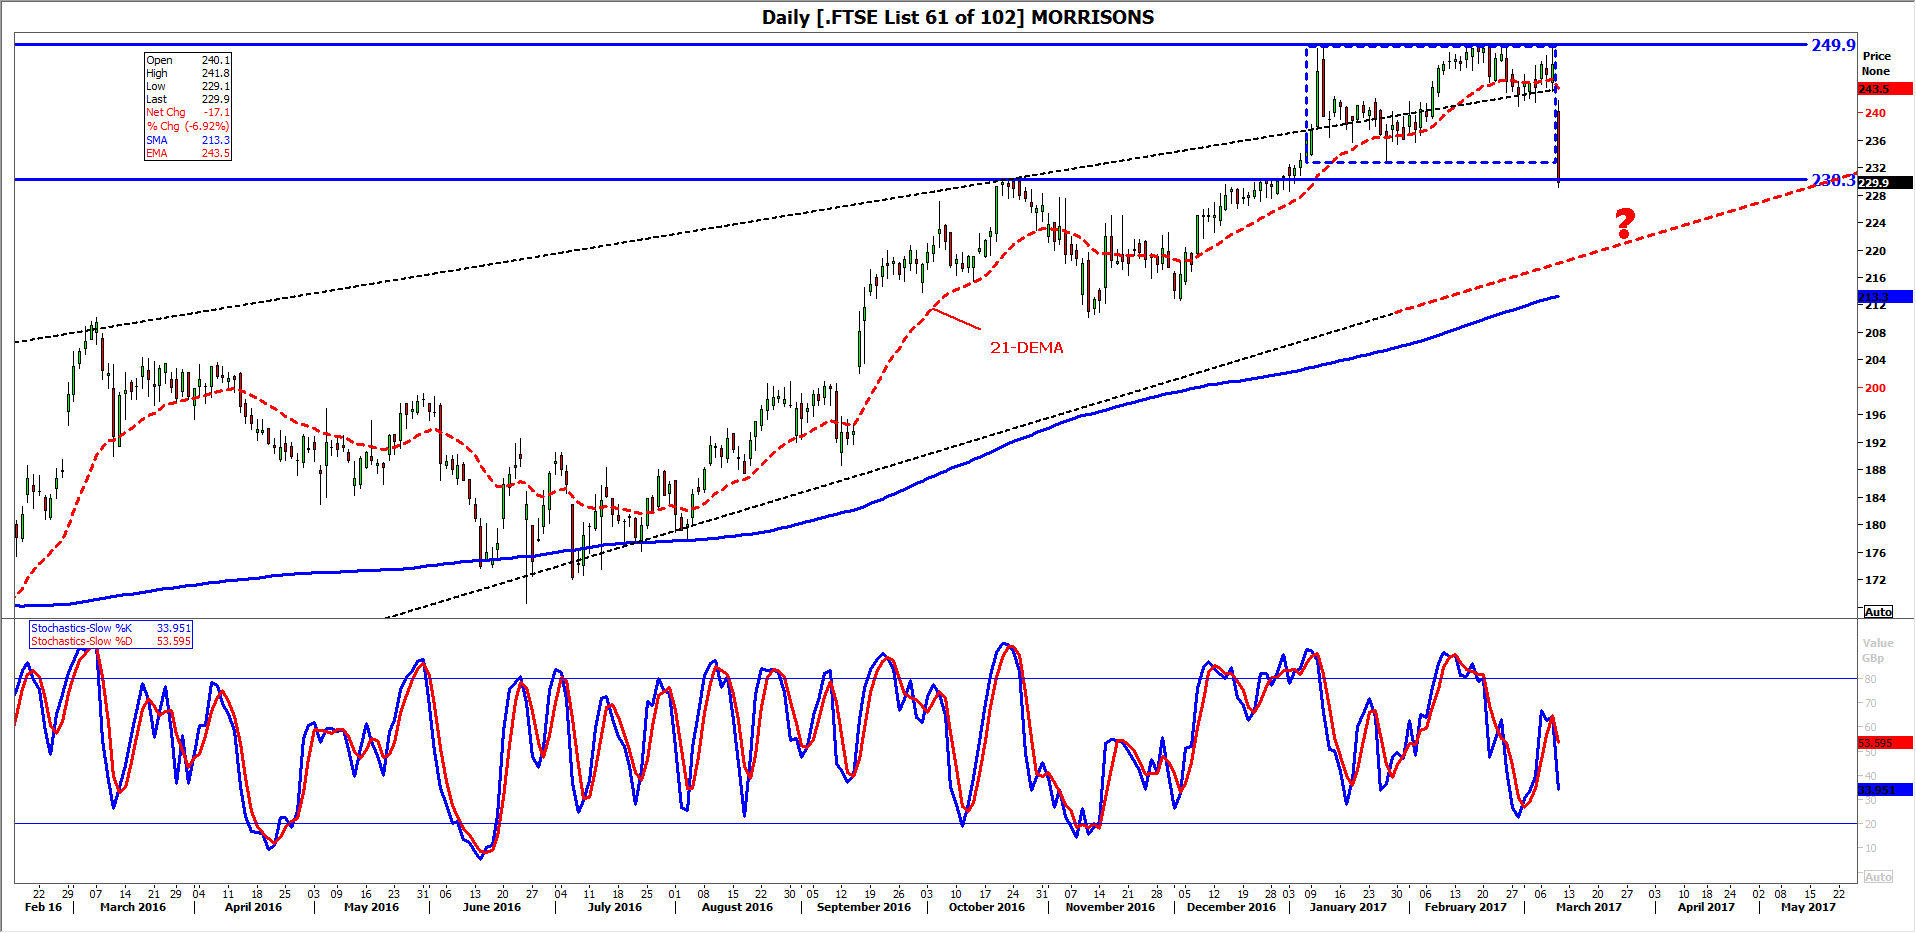
How long that consolidation will last is more in question. The shares are, however, as I write, testing the lower bound of their current monthly standard deviation, at around 230p, and a more significant sell-off would be indicated should that support break. Regardless of the length of the forthcoming correction, the rising wedge pattern in the chart—clear despite rising volatility at its upper edge this year—is an additional bearish motif, particularly as the daily chart below, underscores the extent to which prices have been dragged back inside the wedge after a sustained attempted breakout.
It cannot be ruled out that the shares will reverse and continue the overall ascent that’s been in progress since December 2015. The first sign of that happening would be a failure by sellers to break through 230p support quite soon, despite gross and fine trend gauges (21-day exponential moving average: 21-DEMA; Slow stochastic Oscillator) softening and declining, coincident with a number of busted trends. Our view is that chances that the shares will recover their prior tone soon are slim, although a sweep out of residual short orders between 232p-236p before more committed buying can’t entirely be excluded either. (See blue rectangle on daily chart).
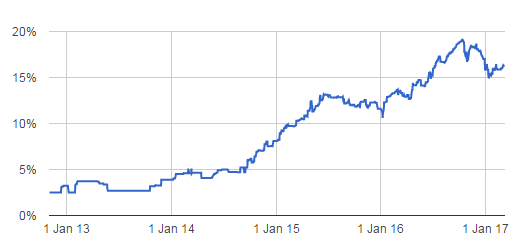
It is interesting to note that whilst short interest in large supermarkets stocks has been higher than the market average for a few years due to their well known travails, more recently, shorts have been declining overall, in line with improving profitability. In Morrisons’ case however, data shows that shorts have been creeping back in this year, according to the FCA’s daily data on the largest short positions. (See chart from Short Interest Tracker - beta underneath the price charts.)
Source: Thomson Reuters and City Index
Source: Thomson Reuters and City Index
Source: Short interest tracker and FCA
