


U.S. President Trump has upped the ante again with his unique “art of the deal” negotiation style towards China. Trump has decided to impose a fresh 10% tariff on a further US$300 billion in China imports to take effect on 01 Sep 2019 despite U.S. and China trade officials are still negotiating for a trade deal with the next round of talks to be held in Washington in early Sep.
Risk assets across the globe have a negative reaction with U.S. stocks reversed down from a gain of 1% to close lower at 1.02% on the average across the benchmark indices (S&P 500, Nasdaq 100 & Russell 2000).
At the time of writing this article, there is still no official response from the Chinese government on its stance towards the latest round of U.S. tariffs. China’s Foreign Minister Wang Yi has been quoted by the press today on the sidelines of a Southeast Asian nations meeting in Thailand that “adding tariffs is definitely not a constructive way to solve the economic and trade fractions”
For equities traders, we need to monitor the movement of the USD/CNH in the next few days as it will have significant ramifications on the stock markets; especially Asian ex Japan and emerging market equities.
USD/CNH – Looking to break above 7.000 with positive momentum
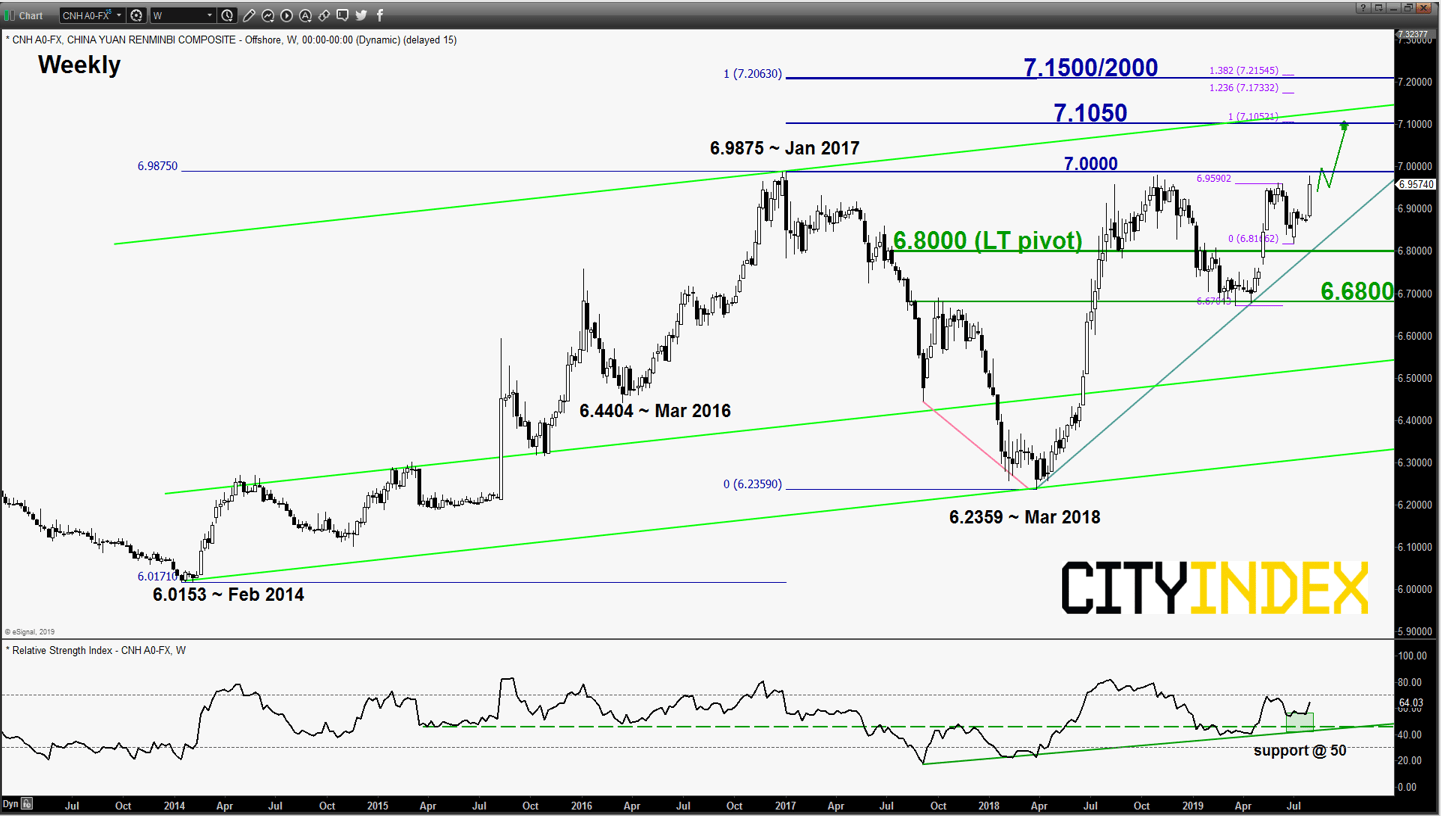
click to enlarge chart
Key Levels (1 – 3 months)
Pivot (key support): 6.8000
Resistances: 7.1050 & 7.1500/2000
Next support: 6.6800
Directional View
Bullish bias with 6.8000 as the key long -term pivotal support with a potential breakout above the 7.000 psychological level to target the next resistance at 7.1050 with a maximum limit set 7.1500/2000. On the other hand, a break with a weekly close below 6.8000 negates the bullish tone for a slide to retest 6.6800.
Key elements
- Since its Mar 2018 low of 6.2359, the USD/CNH (offshore yuan) has been supported by a primary ascending trendline now providing support at 6.8000
- The weekly RSI oscillator has continued to shape a series of “higher lows” holding above a key corresponding support at the 50 level. These observations suggest that upside momentum remains intact to support a further potential up move in USD/CNH.
- The next significant resistance stands at 7.1050 which is defined by the upper boundary of long-term secular ascending channel in place since Feb 2014 low and a Fibonacci projection cluster.
A strong USD/CNH is not good for Asia ex Japan & emerging markets equities
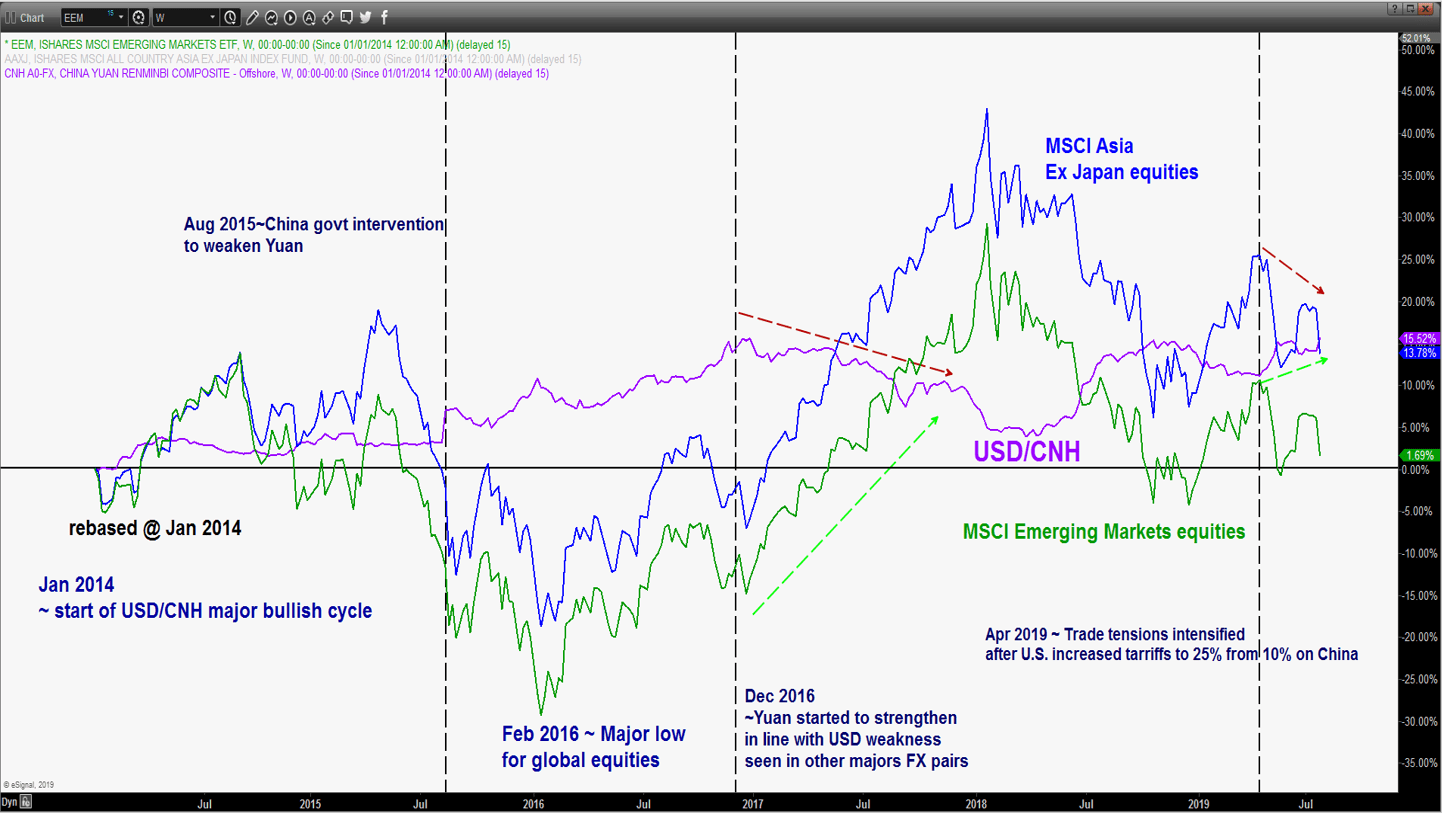
- Since the shock devaluation of the Chinese Yuan in Aug 2015, the movement of the USD/CNH has a significant negative correlation with the MSCI Asia Ex Japan and MSCI Emerging markets stock indices. Based on past observations, a rally in USD/CNH tends to lead to an opposite movement (a decline) in the MSCI Asia Ex Japan and MSCI Emerging markets stock indices. On the reverse, a decline in USD/CNH is likely to see an upward movement in the MSCI Asia Ex Japan and MSCI Emerging markets stock indices.
- Since Apr 2019, the USD/CNH has been on a “slow upward” trajectory which has added downside pressure in Asia Ex Japan and Emerging Markets equities.
YTD performance of Asian ex Japan stock indices normalised in USD
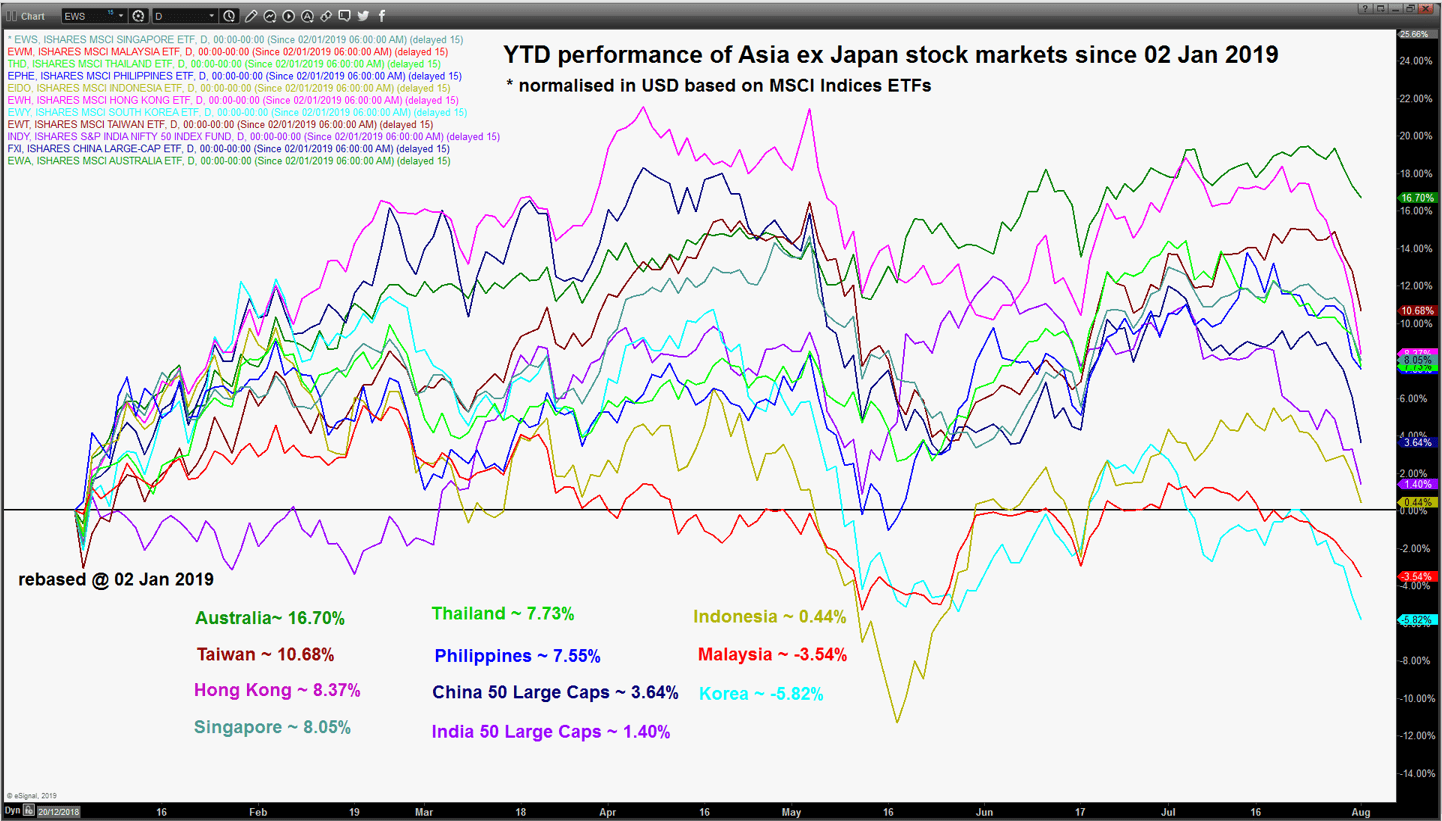
click to enlarge chart
- Since the start of the year Australian equities has been the start outperformer which the MSCI Australia ETF has rallied by 16.70% (in USD terms).
- Therefore, the Australian stock market faces the risk of “late longs” unwinding due to an overcrowded momentum theme play in the last month.
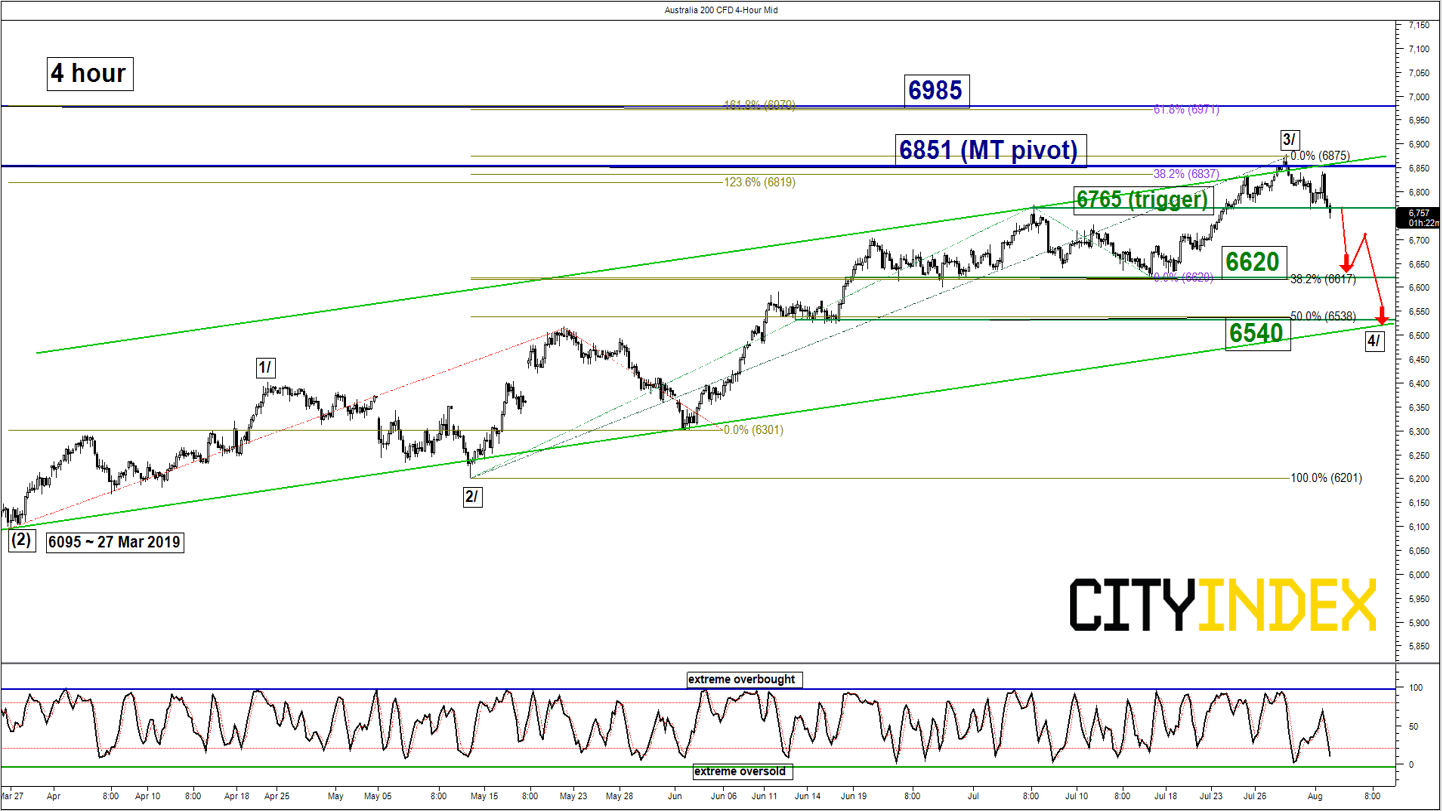
ASX 200 – Risk of a multi-week corrective decline remains intact
click to enlarge chart
Key Levels (1 to 3 weeks)
Pivot (key resistance): 6851
Supports: 6765 (trigger), 6620 & 6540
Next resistance: 6985 (Fibonacci expansion cluster)
Directional View
Maintain bearish bias on the Australia 200 Index (proxy for the ASX 200 futures) and a 4-hour close below 6765 is likely to open up scope for a potential multi-week corrective sequence to target the next supports at 6620 and 6540. On the other hand, a clearance with a daily close above 6851 key medium-term pivotal resistance invalidates the bearish scenario to see an extended impulsive up move towards 6985.
Key elements
- After it a retest on the 6851 all-time high level printed in Oct 2017, the Index has retreated by 1.33% from the upper boundary of the medium-term ascending channel in place since 27 Mar 2019 low.
- Elliot Wave/fractal analysis suggests that an intermediate degree impulsive wave 3/ may have ended at 6878 high printed on 30 Jul and it is likely undergoing a corrective wave 4/ sequence with potential targets at 6620 (38.2% retracement of the up move from 14 May low to 30 Jul 2019 high & 27 Jun/17 Jul swing low areas) and 6540 (50% retracement of the up move from 14 May low to 30 Jul 2019 high & lower boundary of the medium-term ascending channel)
MSCI Emerging Markets ETF (EEM) – At risk of “Expanding Wedge” bearish breakdown
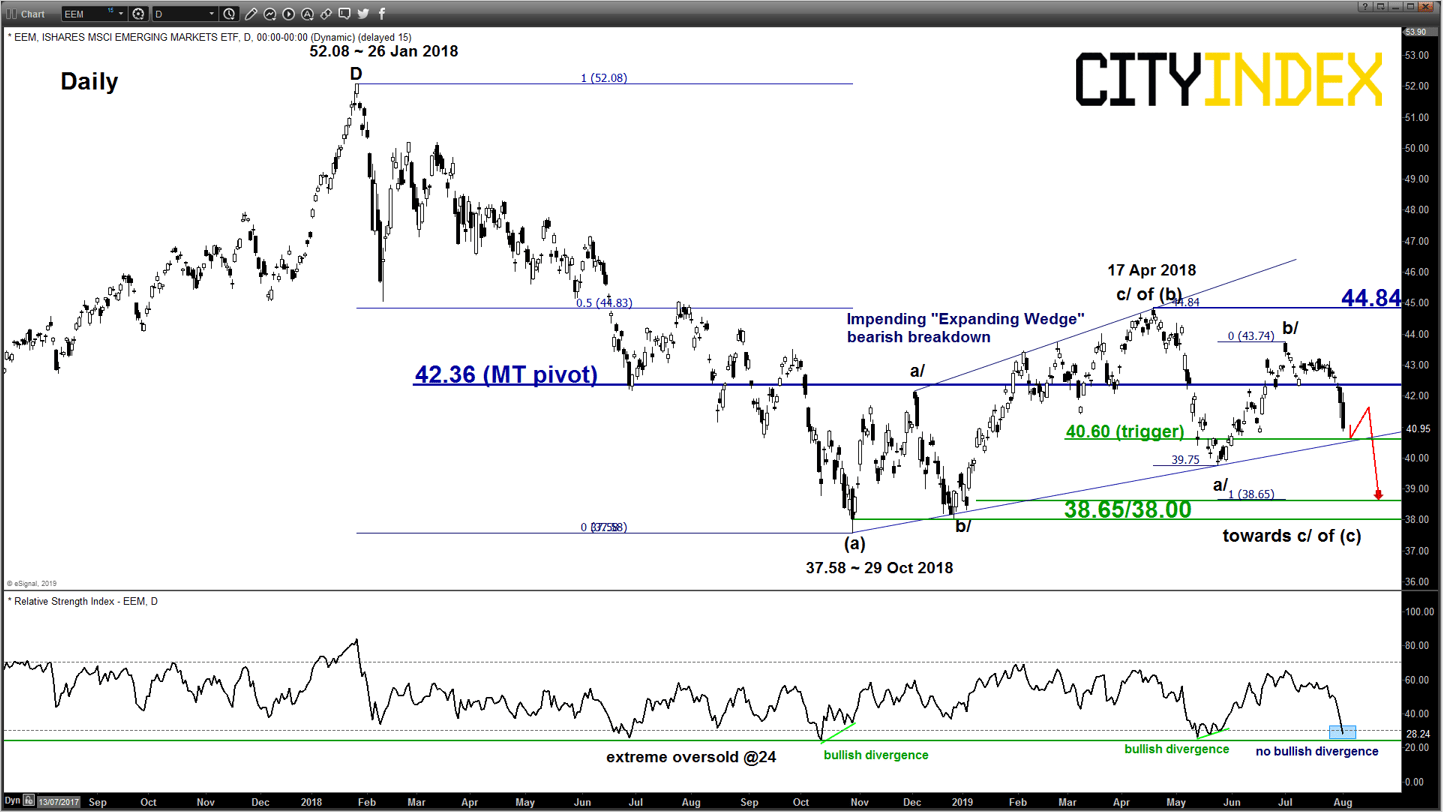
click to enlarge chart
Key Levels (1 to 3 weeks)
Pivot (key resistance): 42.36
Supports: 40.60 (trigger) & 38.65/38.00
Next resistance: 44.84
Directional View
Bearish bias with 42.36 as the key medium-term pivotal resistance and a daily close below 40.60 is likely to reinforce a further potential down move to target the next support at 38.65/38.00. On the other hand, a clearance with a daily close above 42.36 negates the bearish tone for a squeeze up to retest the 17 Apr 2018 swing high of 44.84.
Key elements
- Since its 29 Oct 2018 low of 37.58, the up move seen the MSCI Emerging Markets has been evolving within an “Expanding Wedge” configuration which represents a higher volatility movement than a normal uptrending sequence seen in an ascending channel.
- Therefore, an “Expanding Wedge” configuration tends to end with a potential downside reversal due its unstable/ volatile movement.
Charts are from eSignal & City Index Advantage Trader Pro
Latest market news
Yesterday 03:30 PM
Yesterday 01:23 PM
Yesterday 11:00 AM
Yesterday 08:15 AM
Latest Australia 200 articles
February 15, 2024 11:33 PM
February 15, 2024 01:42 AM
February 14, 2024 05:39 AM