Mixed signals in the UK market compared to US indices
With the UK FTSE 100 providing a clear break to the downside, we have an indication that this index is suggesting that it wants to […]
With the UK FTSE 100 providing a clear break to the downside, we have an indication that this index is suggesting that it wants to […]
With the UK FTSE 100 providing a clear break to the downside, we have an indication that this index is suggesting that it wants to play on the bearish side. But the US Dow Jones has not yet provided any clear signals, creating a divergence between the two indices. Recent price action, however, has seen the FTSE 100 provide earlier signals compared to the Dow Jones and if this is the case then we may see the UK lead the way. The Presidential campaigns are creating hope that could help to lift the markets on a sentiment basis but if momentum weakens then the risk opens the doors to the downside. See key levels below:
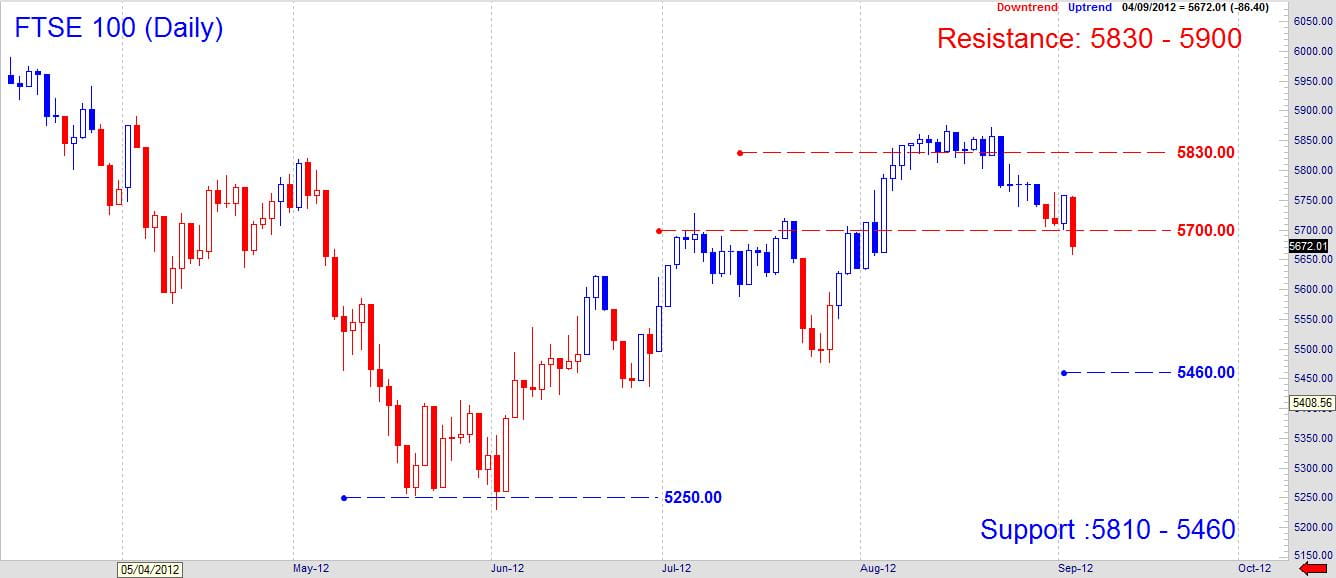
FTSE 100 provides a bearish bias
A wide range move to the downside has seen the FTSE 100 index provide two vital clues. Firstly the index has turned bearish on a momentum basis as indicated by the red bar. Today a break below the low of 5658 would be required to confirm a bearish bias confirmation. Secondly, closing below 5700 indicates a short term trend to the downside should be in place now. If correct the index is likely to trade lower towards two targets. The first objective is currently coming in at 5560 and this is followed by 5460 as the key objective. To negate a bearish bias the index would need to close above 5760.
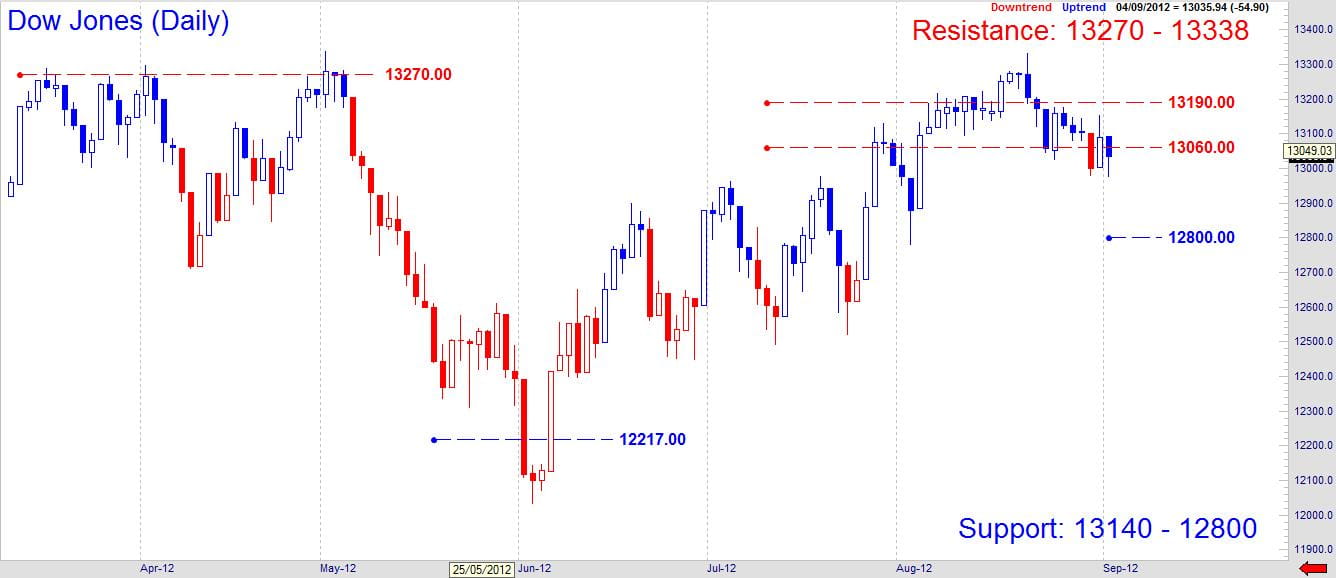
Dow Jones turns bullish again
We saw a potential trend reversal take place on August 30 but this was not followed through successfully. Instead the index reversed to a bullish mode and yesterday saw a failure to break above the high. This causes a difficult trading situation as now the Dow Jones would need to either break above 13095 to move higher or if the index trades sharply lower today and creates another bearish trend bar then once again the opportunity arises for the bears to take over. It is also important for the bears to keep the index below 13060 on a closing basis. The next few trading sessions should provide a clearer picture.
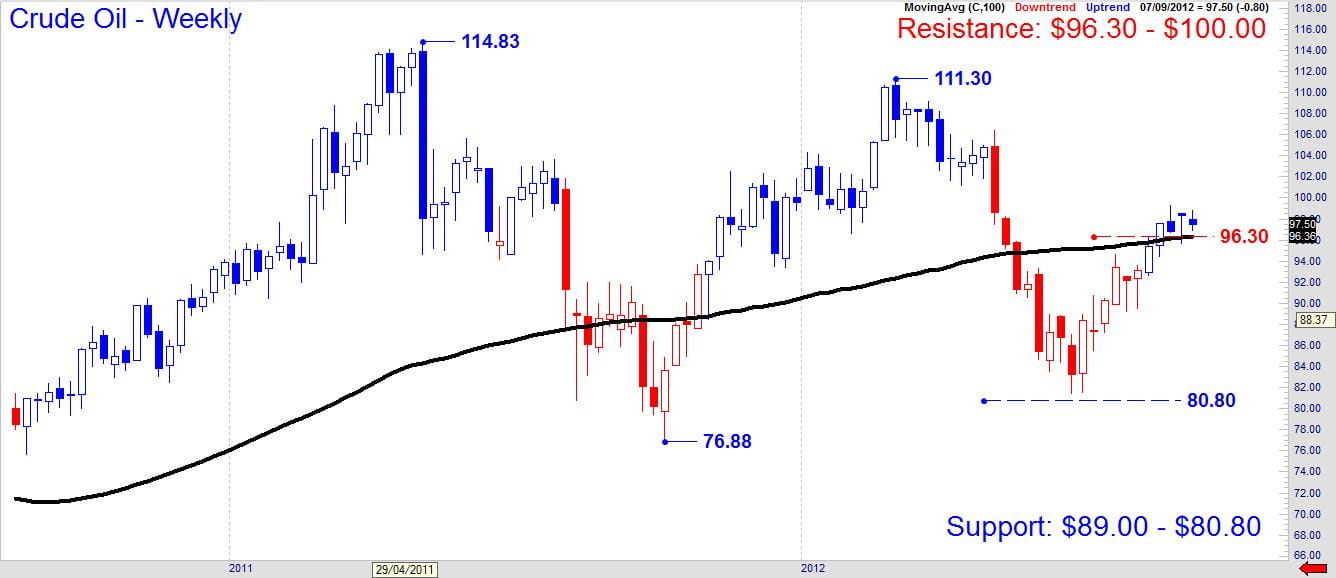
Crude oil still holding above $96.30
An unimpressive move for crude oil so far has kept the commodity above the $96.30 level. But the price action is not showing strength and is also trading closely to the support level. If we see weakness set in and trade below the support level and more importantly, below the 100-period moving average, then the possibility to see oil trade lower increases sharply. An alternative scenario would be to see a consolidation take place at current levels before edging higher again. For the intermediate term oil will need to remain above $92.66 to remain bullish.