


August 24, 2021 11:49 AM
Mexico’s data off to a bad start after latest Banxico meeting: USD/MXN
Mexico released its mid-month inflation rate for August at 5.57% YoY vs 5.74% expected and 5.75% last. Recall that Mexico’s central bank, Banxico, hiked rates on August 12th from 4.25% to 4.5%. Expectations for inflation remain relatively high in the near term, however the central bank expects medium and long-term inflation to converge to its goal of 3%. The central bank also said that they expect the economy to continue to recover, however risks remain related to the coronavirus. Since the meeting, the latest Retail Sales report (JUN) was -0.6% MoM vs 1.1% expected an +0.6% last. Banxico doesn’t meet again until September 30th, however, the worse retail sales and lower inflation aren’t starting the new data cycle too well, especially if the committee wants to hike again at the September meeting. Next week, Mexico will release August Business and Consumer sentiment data. The end of September is still a long way off, however if they economic data continues to be poor and inflation begins to fall (perhaps as a result of rising rates), then Banxico may have a tough time justifying another rate hike.
USD/MXN has been moving lower since the pandemic highs on April 6th, 2020. However, since June 30th, 2020, the pair has been in a descending triangle, putting in lower highs, while holding a strong support level along the way. Notice that during the entire spring and summer of 2021 (thus far), each time price reached the support zone between 19.5491 and 19.7514, it bounced. Also notice how USD/MXN has been putting in lower highs as it approaches the apex of the triangle.
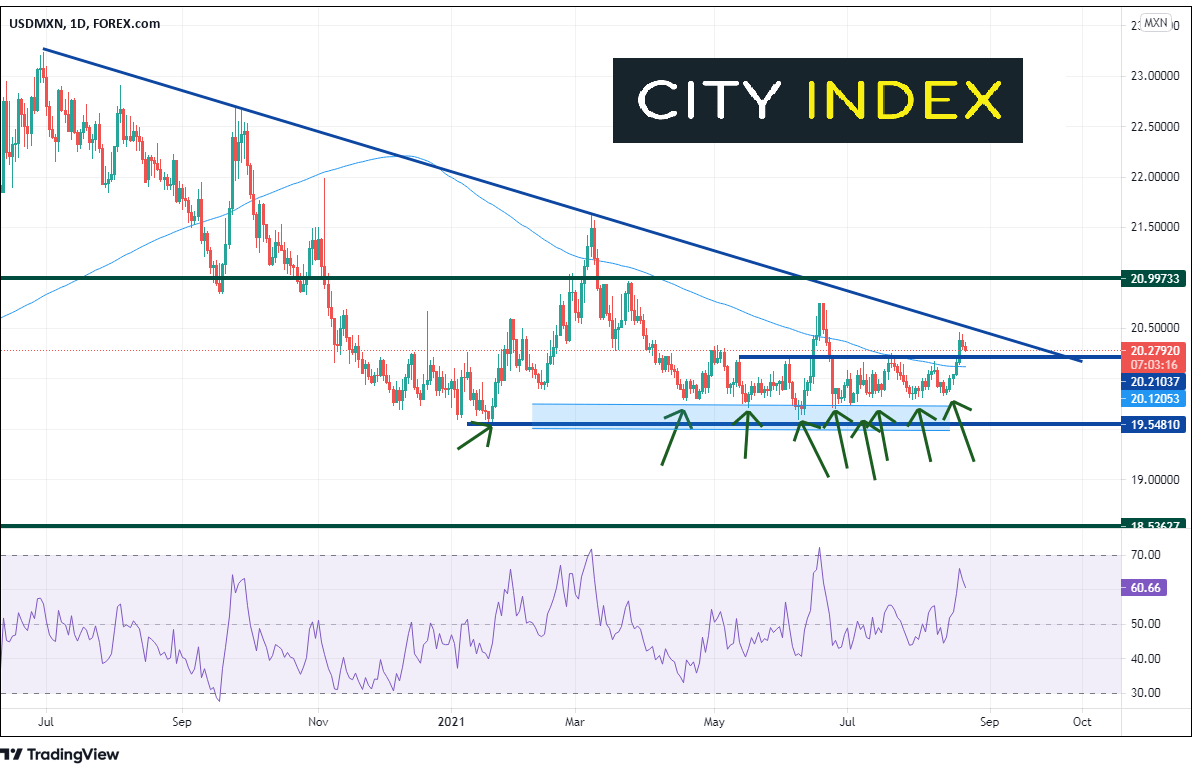
Source: Tradingview, Stone X
Could it be different this time? In mid-June, USD/MXN ran higher through horizontal resistance and above the 200 Day Moving Average, only to reverse and pull back days later. Last week, the pair broke above the same resistance levels, and remain just above them now.
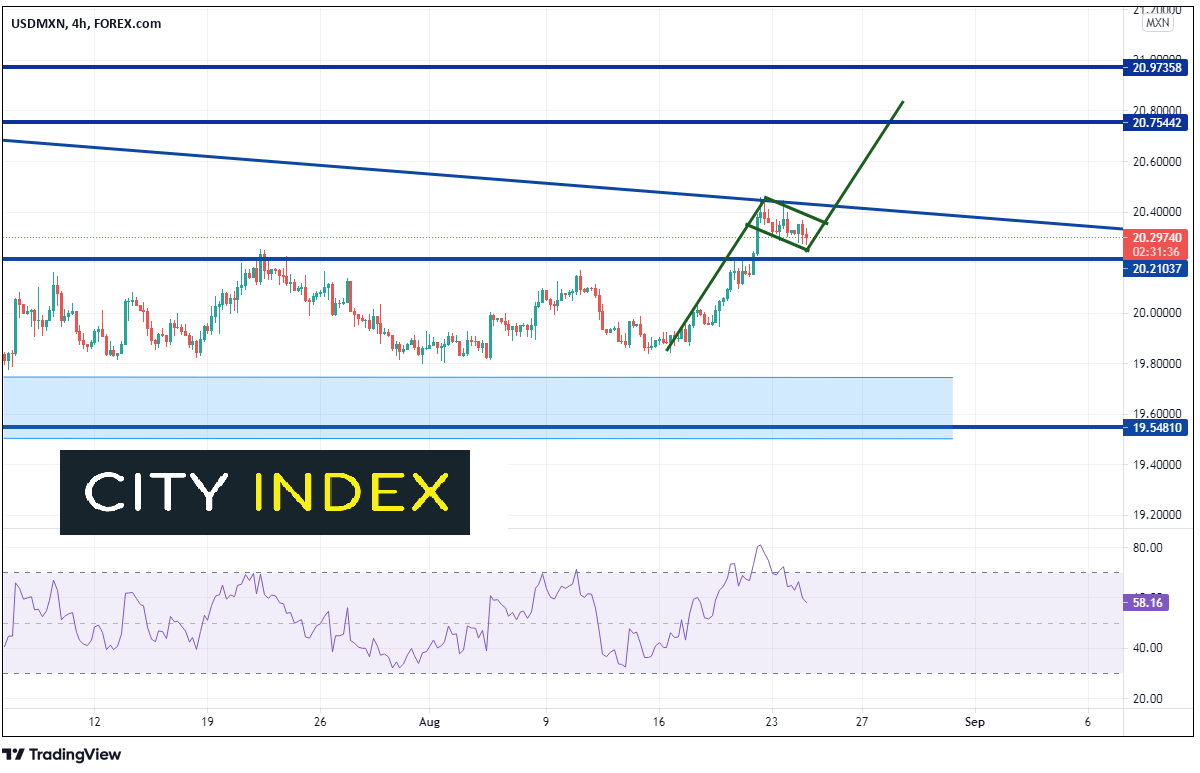
Source: Tradingview, Stone X
On a 240-minute timeframe, USD/MXN moved right to the downward sloping trendline and pulled back in a consolidated formation, into what looks like a potential flag formation. If so, the target for the flag is near 20.8300, above the triangle trendline resistance near 20.4565 and horizonal resistance at 20.7544! Notice that the RSI has unwound from overbought conditions and price consolidated, now allowing for a possible move higher. However, if the pattern fails and price pulls back, the previous resistance (now support) is at 20.2104 and the 200 Day Moving Average near 20.1205. Below there is the top of the long-term support zone near 19.7514.
If inflation continues to fall in Mexico over the next month, and economic data is weak, Banxico will have a tough time justifying higher rates. This may allow for USD/MXN to move higher.
Learn more about forex trading opportunities.
Latest market news
Today 01:15 PM
Today 11:30 AM
Today 08:18 AM
Latest Forex articles


Yesterday 11:30 AM
Yesterday 03:42 AM