


April 27, 2021 4:58 PM
Mexico: Poor economic data and higher inflation
Mexico released its March trade balance earlier and the print continued the recent trend of poor economic data. The expectation was for $3.2B vs $2.681B in February. The result however was -$3.004B, although both imports and exports were much stronger YoY. Looking at some recent data from Mexico, a trend seems to be emerging. In addition to a worse than expected trade balance, other data over the past week missed expectations as well:
- Economic Activity (FEB): -3.9% expected; -5.1% actual - WORSE
- Retail Sales (FEB): -5.4% expected; -6.3% actual - WORSE
- Mid-Month Inflation report (APR): 5.84% expected; 6.05% actual – WORSE
The only report that was better was the March Unemployment rate, which was 3.9% vs 4.2% expected. However, the decrease in economic data and the rise in inflation should worry the Bank of Mexico (Banxico), who meet again on May 13th. Of course, before then, Mexico’s central bank will have a look at April Business Confidence and March Industrial Production, as well as another look at the inflation rate. However, if the trend continues, Banxico will have a problem: higher inflation and lower economic data!
What are emerging market economies?
When the Bank of Mexico last met in March, the committee left rates unchanged at 4% after cutting 25bps in February. Banxico had to be happy when USD/MXN broke higher out of the descending wedge on February 18th, which the pair had been in since early April 2020. With the help of a strong US Dollar in first quarter of 2021, the pair briefly broke above the 200 Day Moving Average and made a high on March 8th at 21.6355. However, the pair pulled back into the March 25th meeting had continued lower since.
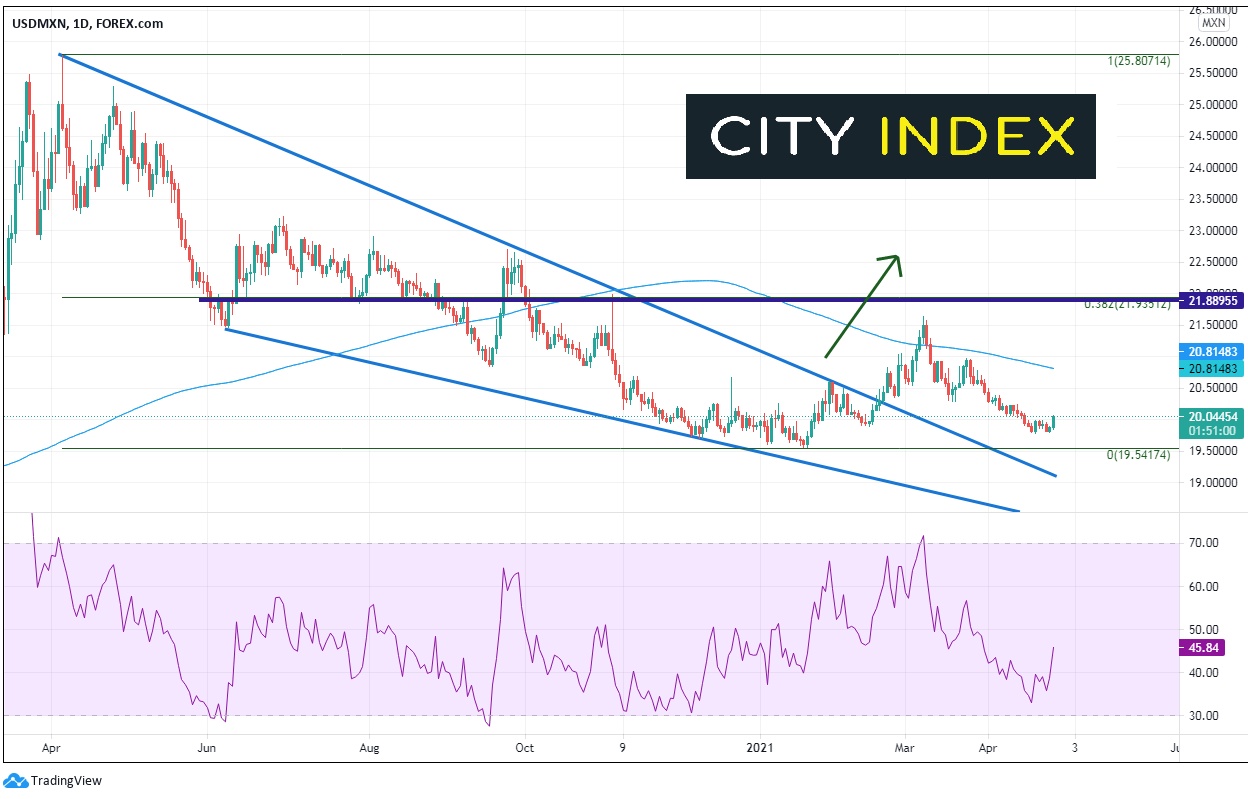
Source: Tradingview, City Index
On a 240-minute chart, after moving lower from the recent highs on March 8th, the pair formed another descending wedge, this time with the help of a weaker US Dollar. However, with poor data out of Mexico over the past week, USD/MXN was forced higher out of the descending wedge. First horizontal resistance is at 20.2475, and then a confluence of horizontal resistance and the 38.2% Fibonacci retracement level from the March 8th highs to the April 20th lows near 20.50. Support is back at the April 20th lows of 19.78518, the top downward sloping trendline of the wedge near 19.728 and the bottom trendline of the wedge near 19.64. Note that the RSI is just beneath the 70 overbought/neutral line.
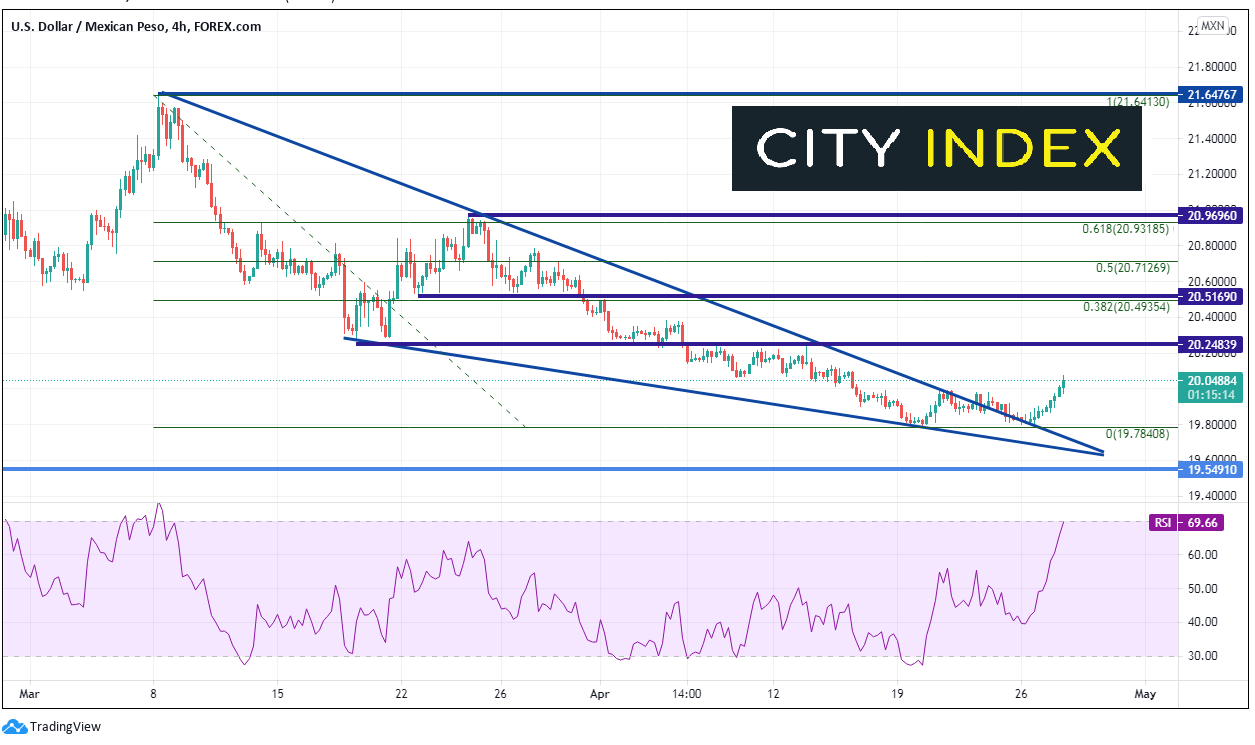
Source: Tradingview, City Index
Learn more about forex trading opportunities.
Latest market news
Today 11:14 AM
Today 08:28 AM
Yesterday 03:30 PM
Latest Forex articles

Yesterday 11:00 AM
April 23, 2024 11:09 PM
April 23, 2024 04:00 PM