


The dollar remains under pressure and could well go on to print new lows. Yet over the near-term, could be due a bounce.
By Friday’s close, it was the worst 12-day trading period for the US dollar index (DXY) since August 2018. And whilst it remains within a bullish channel, the magnitude of its decline should not be ignored as it is arguably the straightest line bears have carved out within the said channel. Still, such extreme levels of one-directional trading can also flag the potential for mean reversion. At least over the near-term.
Take note that Friday closed near the top of a support zone and produced a Rikshaw Man Doji yesterday to show a hesitancy to push immediately lower. And it’s not broken convincingly beneath the 200-day MA, a technical level it has flirted with yet struggled to hold beneath since breaking above it in April 2018. Therefore, a technical bounce could be on the cards.
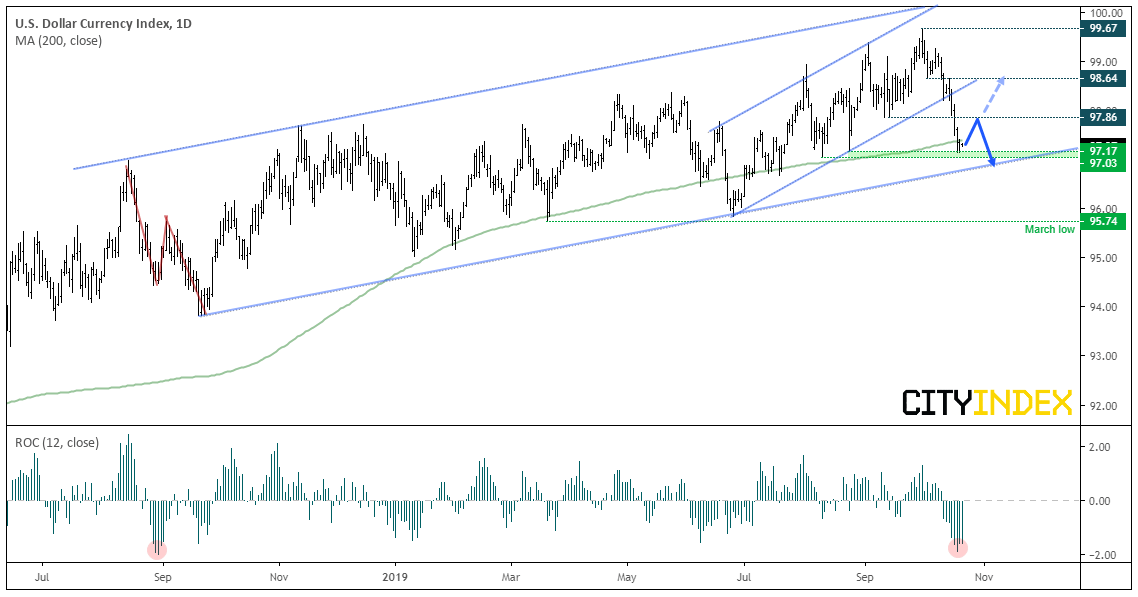
That this occurs at a time when other USD pairs are looking stretched and at / nearing key levels, then the odds of a correction (if only minor) are present. At this stage it remains unclear how deep a bounce dollar could be in for but, at the very least, it can serve as a warning for USD bears who may be a little late to the party.
- Due to the direct losses DXY has endured, we doubt this is the final price low. Yet at the same time, beckons a correction as prices do appear stretched over the near-term.
- If / when a bounce occurs, we’ll then monitor prices to see if it can retest the lower channel. A break of this could see DXY head for the lows around 96.
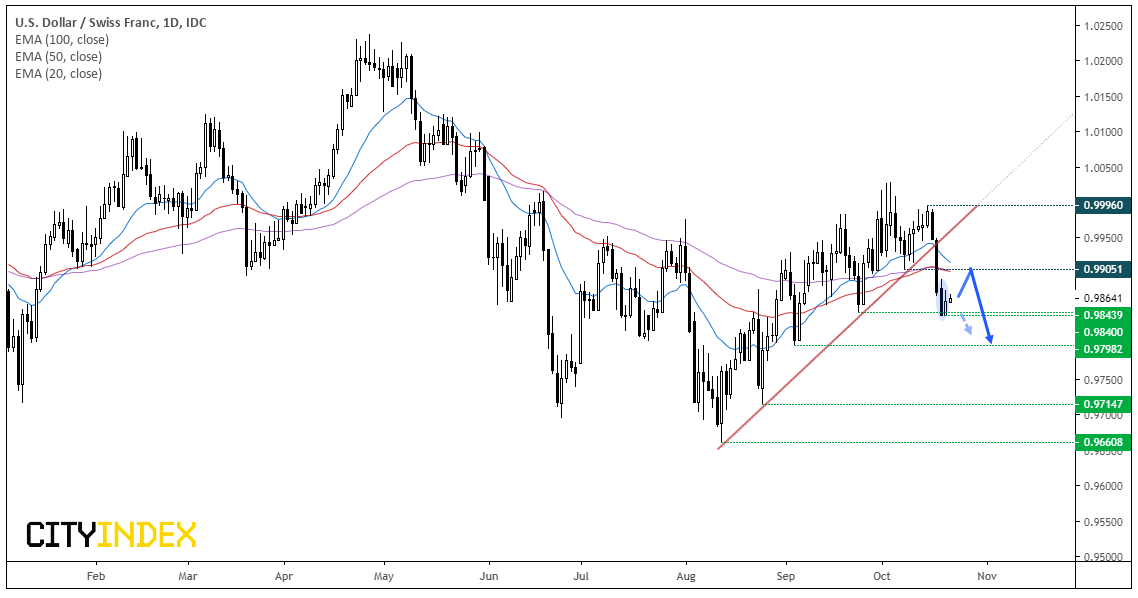
USD/CHF: A lower high was ahead of its break beneath the bullish trendline. Support has been found around 0.9840 and yesterday produced a 2-bar reversal pattern (bullish piercing line) and fits into the narrative for a correction for the USD. However, a cluster of averages lay around the 0.9905 resistance level to provide a decent area of resistance for bears to consider fading into.
Bearish sewing traders could look for signs of weakness below 0.9905. Alternatively, if prices consolidate around current levels, then traders could look for a break to new lows.
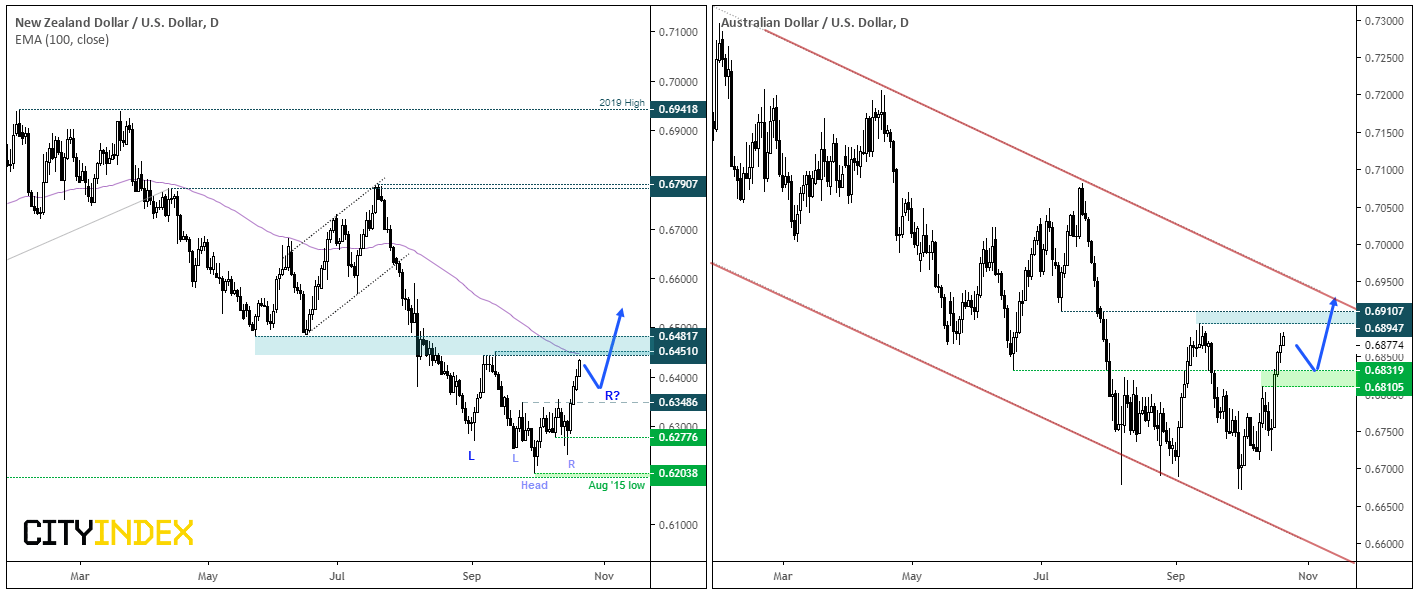
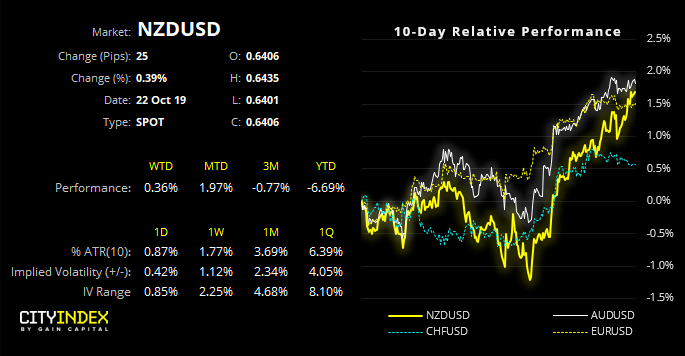
NZD/USD: The Kiwi is within striking distance of the 0.6450 target, after breaking out of an inverted head and shoulders pattern. Furthermore, the pattern could also be the head of a larger inverted H&S. Time will tell, but its interesting none the less. Whilst momentum is firmly bullish, we’d usually expect prices to at least pause around key resistance (if not retrace) before continuing its move. Moreover, the 100-day eMA and 0.6482 resistance level are also nearby to take the wind out of bullish sales, even if only temporarily.
AUD/USD: The Aussie is also approaching key resistance, although yesterday’s wide-bodied doji shows suggests the move is losing a little steam. Ultimately, the reward to risk potential appears undesirable for bulls around current levels, as they also have the bearish channel to contend with. Overall though, price action on NZD and AUD only underscore the potential for the USD to catch a bid.
Latest market news
Yesterday 08:33 AM
Latest Forex articles
April 17, 2024 02:40 PM
April 17, 2024 04:47 AM
April 16, 2024 12:00 PM
April 16, 2024 04:24 AM