


In today’s early Asian session, a report from SCMP (South China Morning Post) has stated that U.S. and China have not make any progress in deputy-level trade talks ahead of today’s key trade negotiation talk between higher ranking officials according to sources.
The first reaction from this negative news flow has triggered a risk off across the board with the S&P 500 E-Mini futures dropped by -1.2% to retest Wed, 09 Oct low of 2888, a drop of 60 pips in the USD/JPY from yesterday, 10 Oct high of 107.63 to print a current Asian session intraday low of 107.01 in line with a drop of 43 pips in the AUD/USD from yesterday high of 0.6750 to today’s Asian session current intraday low of 0.6706. In addition, the USD/CNH (offshore yuan) has pushed up by 46 pips from yesterday low of 7.1214 to today’s Asian session current intraday high of 7.1682.
Thereafter within a span of two hours, Bloomberg has reported that the U.S. administration is looking to roll out a previously agreed currency pact with China that could also see the suspension of the planned tariff increase; 30% from 25% on US$250 billion of Chinese imports to be scheduled on 15 Oct. The currency accord includes terms to ensure China do not engage in competitive devaluation of the yuan, though there are no details out yet. Also, the U.S. administration has considered previously before trade talks broke down that that the currency pact would be a first-phase agreement with China follow by more negotiation talks on intellectual property and forced technology transfers, the sticking points that China do not come to terms with the U.S. in the previous rounds of talks.
Markets have reacted positively to the currency pact news flow where the S&P E-Mini futures, AUD/USD, JPY and CNH have erased all their earlier respective losses. As we head into the high-level U.S-China trade talk today, there will be several “breaking news” headlines that will spurt out in the next 24 hours. Traders need to apply prudent risk management techniques at this juncture and apply technical analysis to decipher the price movement and key levels. Let’s us now look at the USD/CNH.
USD/CNH – In consolidation mode within a longer-term uptrend
click to enlarge charts
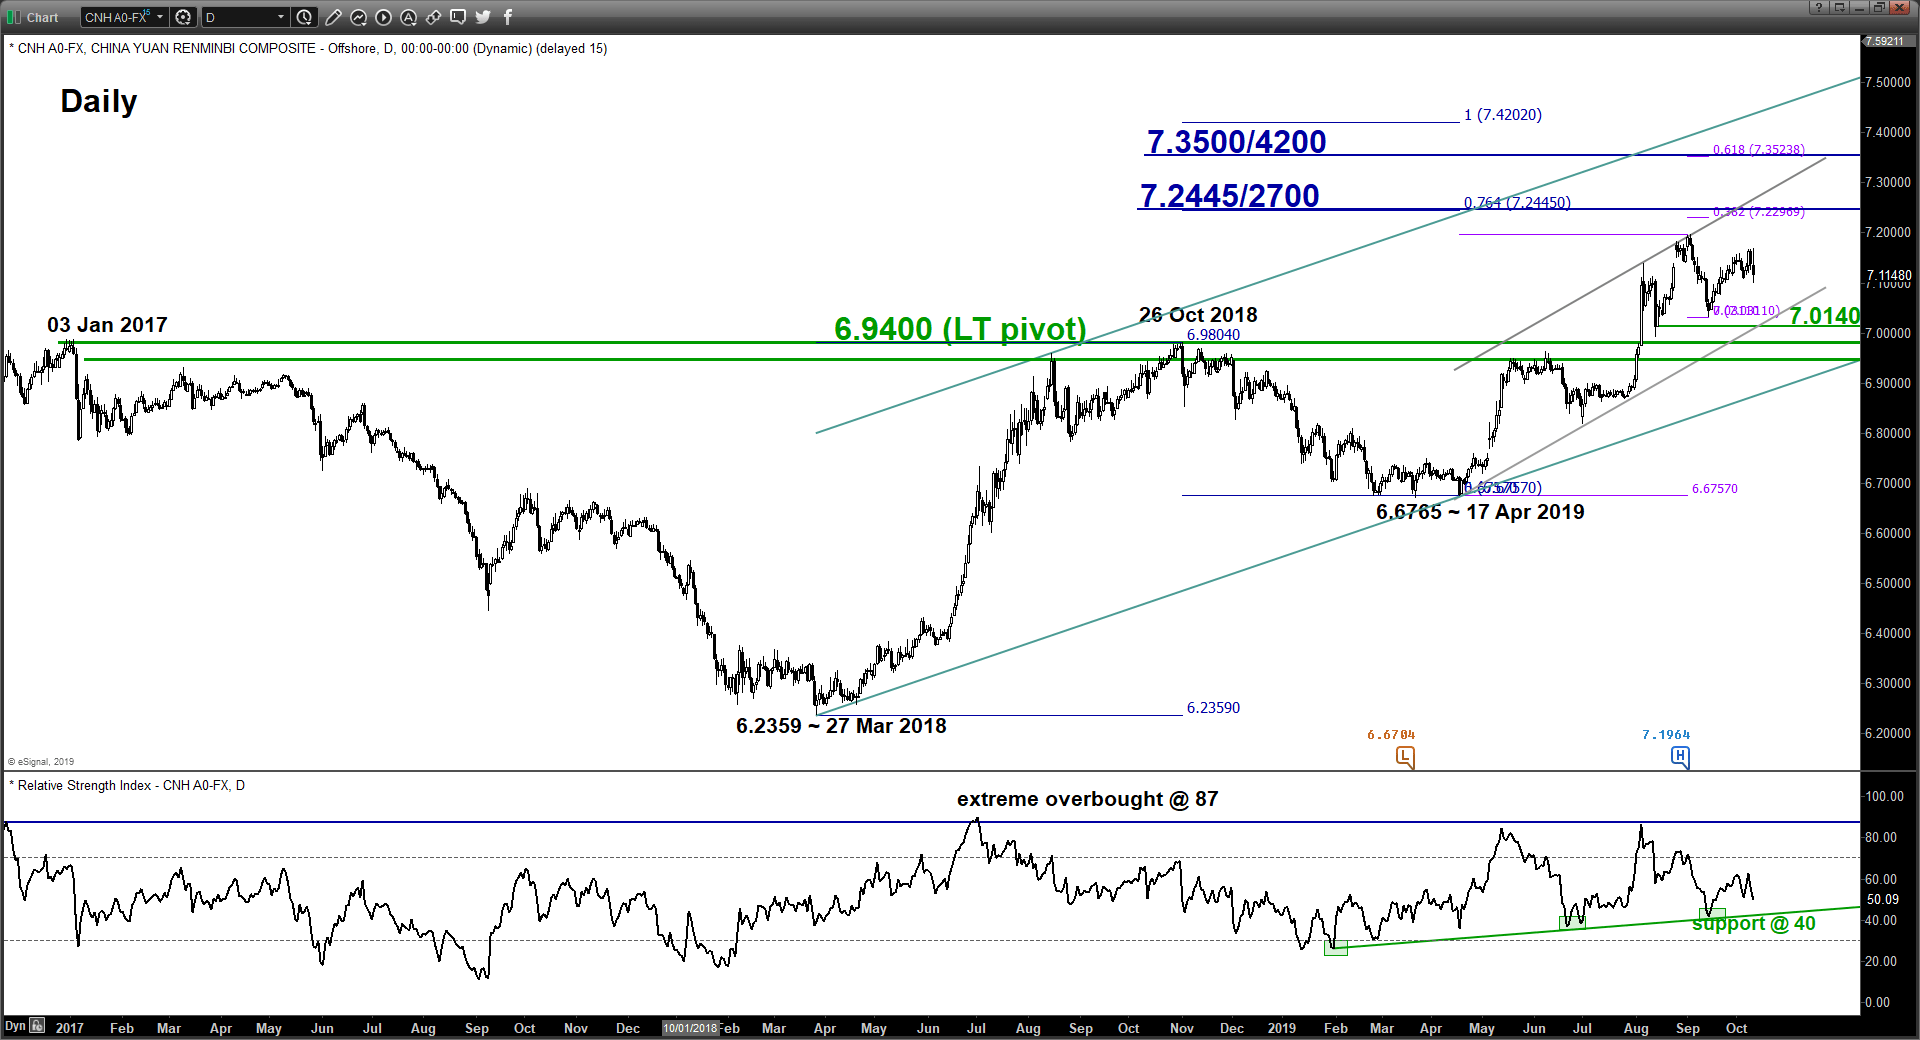
- From a longer-term perspective, the primary uptrend in place since 27 Mar 2018 low of 6.2359 remains intact with its key long-term pivotal support at 6.9400 as it continues to evolve within a multi-year ascending channel (refer to daily chart).
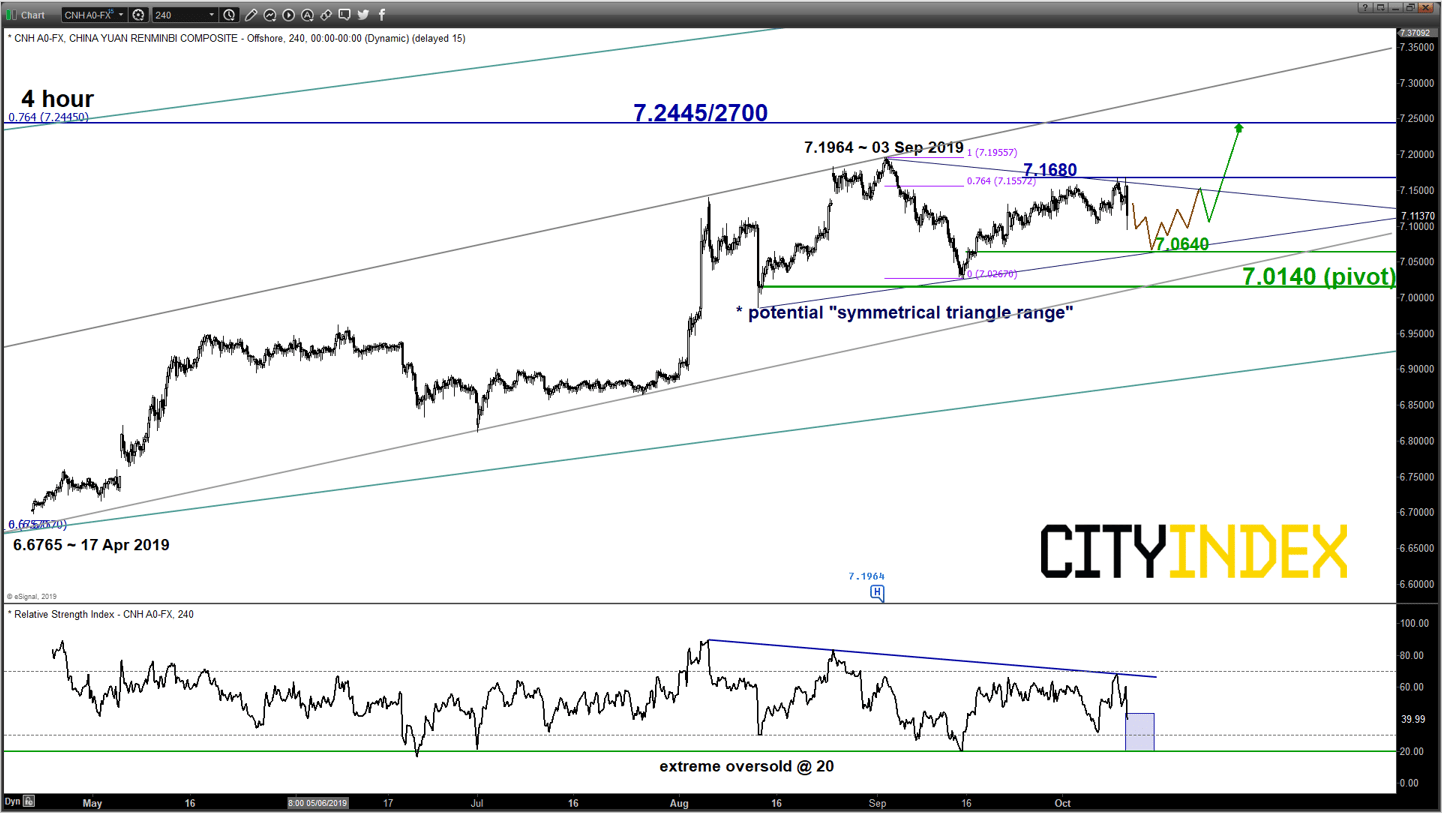
- In the short to medium-term (1 to 3 weeks), the pair has traded sideways since its 03 Sep 2019 high of 7.1964. Current price actions suggest it may be consolidating in a “Symmetrical Triangle” range configuration within a medium-term ascending channel in place since 17 Apr 2019 low of 6.6765. Interestingly, the earlier push up from 7.0267 low of 13 Sep 2019 to 10 Oct 2019 high of 7.1680 has stalled at the 76.4% Fibonacci retracement of the previous slide from 03 Sep high to 13 Sep 2019 low, a typical price action behaviour of “triangle range” consolidation according to Elliot Wave/fractals analysis.
- The 4-hour RSI oscillator has remained below a significant corresponding descending resistance and still has room for further downside before it reaches an extreme oversold level at 20. These observations may translate into a further slide in price action towards the lower boundary of the “Symmetrical Triangle” range now acting as at support at 7.0640, also close to the 76.4% Fibonacci retracement of the prior push up from 13 Sep low to today, 10 Oct 2019 current intraday high of 7.1682.
- Key medium-term support to watch will be at 7.0140 which is defined by lower boundary of the medium-term ascending channel from 17 Apr 2019 low, minor swing low area of 13 Aug 2019 and the 50% Fibonacci retracement of the on-going multi-month uptrend from 01 Jul low to 03 Sep 2019 high.
- Therefore, the USD/CNH may see a pull-back first towards 7.0640/7.0140 key support zone and a break above 7.1680 is likely to reinforce the start of another potential impulsive upleg sequence to target the next resistance at 7.2445/2700.
- On the other hand, a daily close below 7.0140 extends the slide to test the key long-term pivotal support at 6.9800/9400.
Charts are from eSignal
Latest market news
Today 08:15 AM
Today 05:45 AM
Latest Forex articles

Yesterday 11:09 PM
Yesterday 04:00 PM
Yesterday 04:19 AM