Markets now set for short term counter trend rally
The market turmoil which saw stock indices jumping between +/- 3% on a daily basis has now shown its hand. The FTSE 100 reached the […]
The market turmoil which saw stock indices jumping between +/- 3% on a daily basis has now shown its hand. The FTSE 100 reached the […]
The market turmoil which saw stock indices jumping between +/- 3% on a daily basis has now shown its hand. The FTSE 100 reached the lower price target and has also created a reversal signal on a weekly chart. Does this mean that the bearish move is over? Given the patterns and trend analysis the market itself suggests that there is likely to be more turmoil ahead if key levels on the upside are not taken out soon. Meanwhile gold continued higher reaching price objectives without any problems and crude oil also managed to reach the exact price target as well as bouncing higher but upside may also be limited here. Key price levels are provide below:
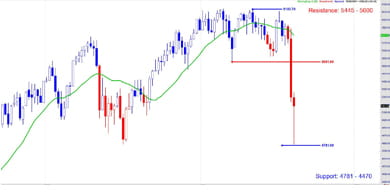
FTSE 100 creates reversal signal
The FTSE 100 target of 4781 was reached but missing the mark by a hairline of 11 points. As the index sliced through support levels with rapid declines and also jumping several hundred points in as much as hours the index looks set to trade upwards for the short term. There is a Candlestick pattern referred to as a Hammer which occurs at market lows. This has taken place and with the index now looking forward to 5445 followed by 5600 this is likely to be followed with another bearish move. Right now the FTSE needs to stay above 4940 for this move to play out.
FTSE 100 Weekly
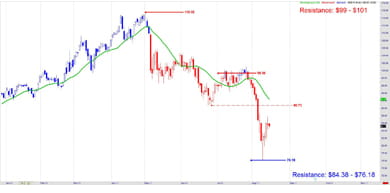
Crude Oil in line for a bounce higher
In line with the recent forecast of lower crude prices the bearish scenario has played perfectly by creating an ABCD pattern taking the commodity down to $76.18 and creating a V reversal on the daily chart. Most likely Oil will be looking to complete the upside move by reaching for $90.73 before finding resistance. This also coincides with its Moving Average line and also other short term technical levels. Choppy price action is likely between $90 – $76 but the trend remains bearish unless the $99 – $101 resistance level has been taken out.
Crude Oil Daily
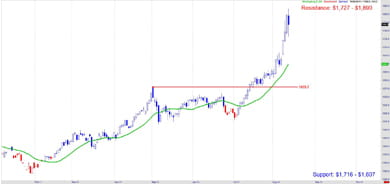
Gold not finished just yet
The October contract of Gold is looking to reach for $1,890 after reaching the $1,727 level last week. However the parabolic move is looking a little too far stretched and may offer a pullback towards its short term moving average towards the $1,716 area. Failure to hold here may even see Gold fall lower to $1,607 as a base line support. But longer term the metal remains in line with the $2,000 level reaching closer as stock markets create uncertainty and investors looking for safety as well as traders backing the speculative move. Staying with the trend remains key.
Gold Daily