Markets in the run up to the 2010 and 2015 UK Elections
Technical Analysis of GBP/USD, FTSE 100, and EUR/GBP GBP/USD 2010: In the run-up to the UK elections back in May of 2010, GBP/USD had been […]
Technical Analysis of GBP/USD, FTSE 100, and EUR/GBP GBP/USD 2010: In the run-up to the UK elections back in May of 2010, GBP/USD had been […]
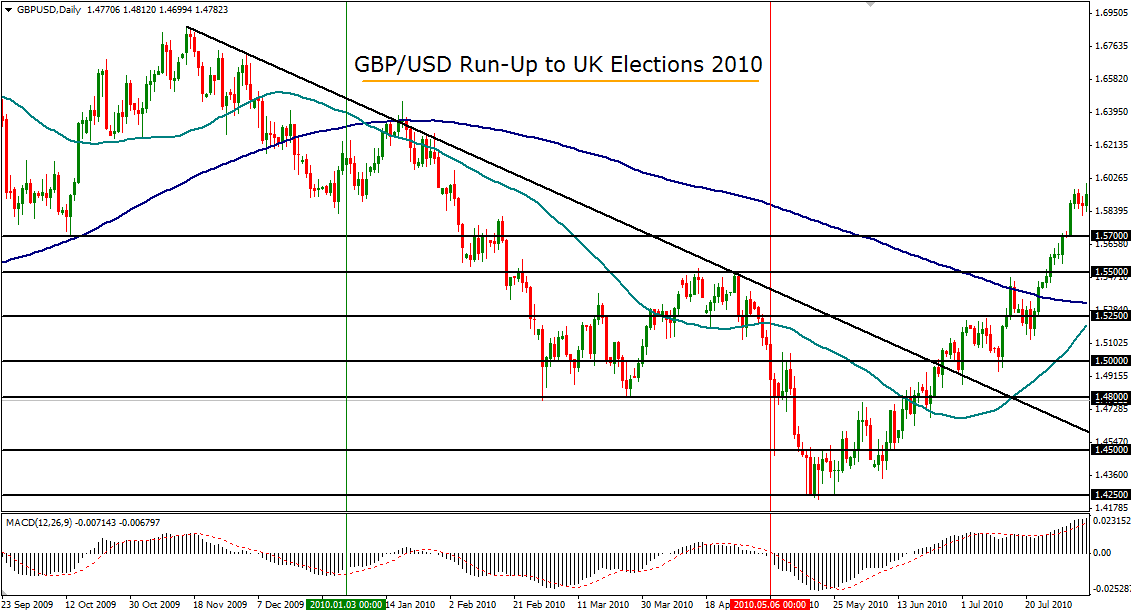
In the run-up to the UK elections back in May of 2010, GBP/USD had been entrenched in a general downtrend from around the 1.7000 level in the prior year.
From nearly the beginning of 2010, the currency pair continued to slide, but then made a pronounced rebound off the key 1.4800 support level in March of that year.
The rebound pushed GBP/USD up to major resistance at 1.5500 during the month of April before retreating once again in the few days running up to the 2010 elections.
This retreat continued virtually unabated until the day after the elections, when the currency pair spiked down to a low below 1.4500 support. The declines did not cease until late May, several weeks after the elections, when GBP/USD began to rise from its 1.4250 support lows.
This bullish trend reversal continued for another year, climbing back up steadily until reaching a peak of 1.6745 in late April 2011.
In summary, sterling was in a substantial decline against the dollar in the months and days running up to the 2010 elections, as well as a few weeks following the elections. This longstanding bearish trend reversed shortly after the elections to begin a strong and prolonged recovery.
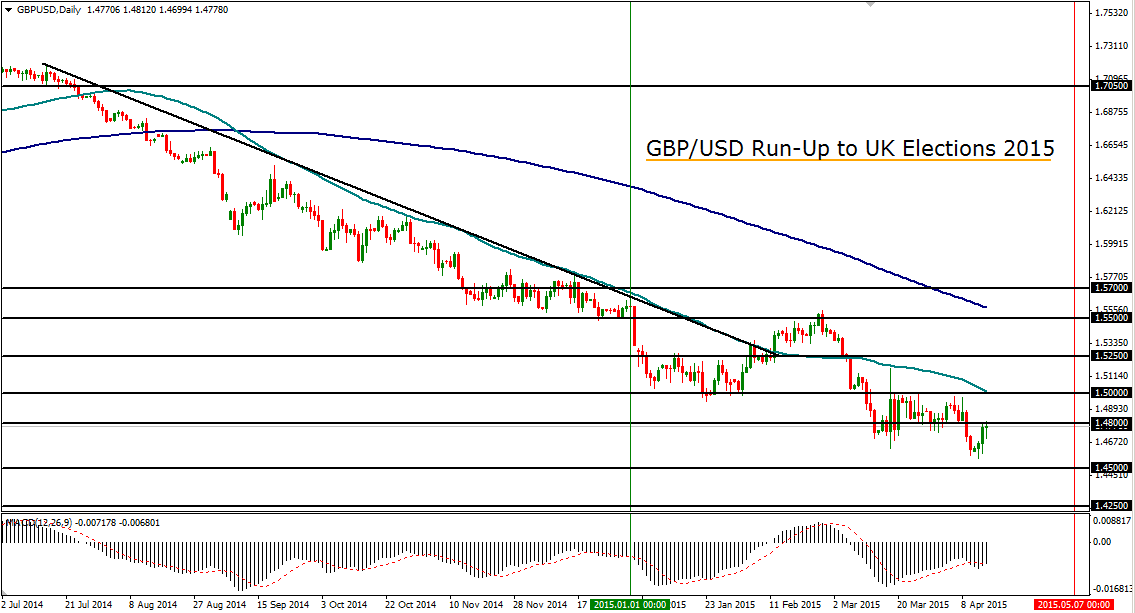
The current run-up to the upcoming 2015 elections is showing somewhat of a similar picture to the 2010 chart. The currency pair has been in a pronounced downtrend since its 1.7190 high back in July of 2014. A new four-year low of 1.4565 was hit in mid-April, just short of reaching its 1.4500 support target.
At the time of this writing in mid-April, GBP/USD is still trading well under both the major 1.5000 resistance level as well as the 50-day moving average. Currently, if the currency pair continues the entrenched downtrend to hit lower lows, the key downside support targets reside around the noted 1.4500 level and then the 1.4250 level.
If a bullish trend reversal occurs shortly after the May elections, as what happened in 2010, a trend change could potentially be indicated on a breakout above 1.5250 and then 1.5500. This could potentially form an inverted head-and-shoulders reversal pattern.
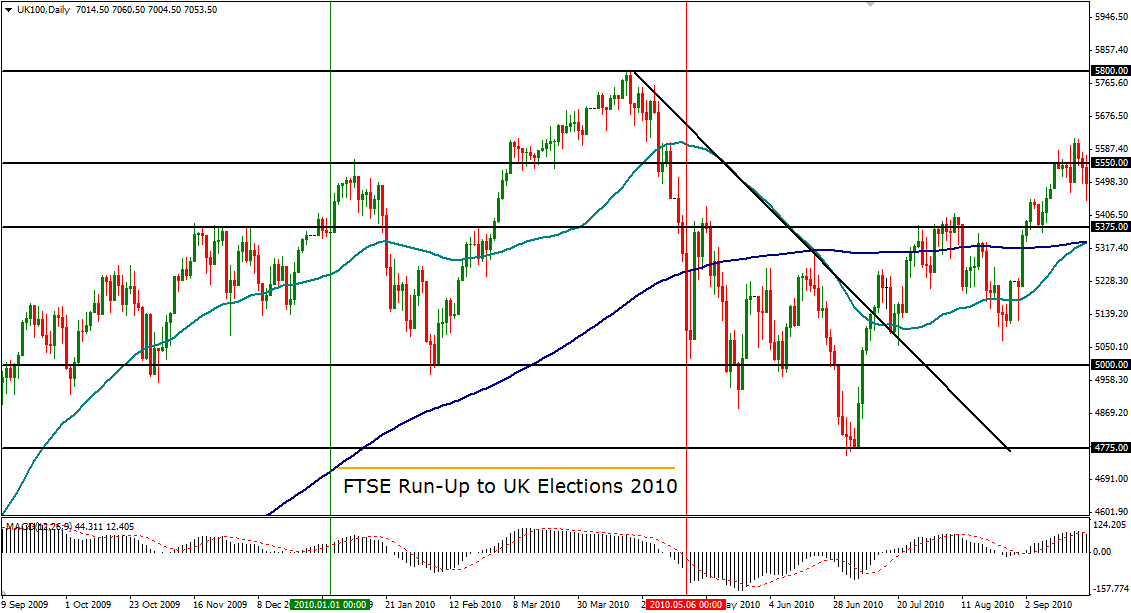
The FTSE 100 index in the months preceding the early May 2010 UK elections was sharply bullish from February of that year up to mid-April, when it topped out just short of the key 5800 level.
From there, the index spent the next three weeks immediately preceding the elections in a virtual freefall. Notably, the actual day of the elections, 6 May 2010, extended the freefall with a dramatic plunge that spiked well below the key 5000 level before settling back above it by the close of trading that day.
After the elections, there was a brief respite and rebound before the FTSE resumed its bearish stance once again and eventually made its way down to the 4775 support area by July of that year.
On bottoming out around 4775 in July, the index then began a sustained rise that would last well into 2011.
In summary, the FTSE 100 approached the 2010 elections with a steep rise followed by an even steeper plunge shortly before the elections that continued to weigh down the index for two months after the elections. Subsequent to that drop, the short-term trend then reversed and eventually recovered more than its losses going into the latter part of that election year.
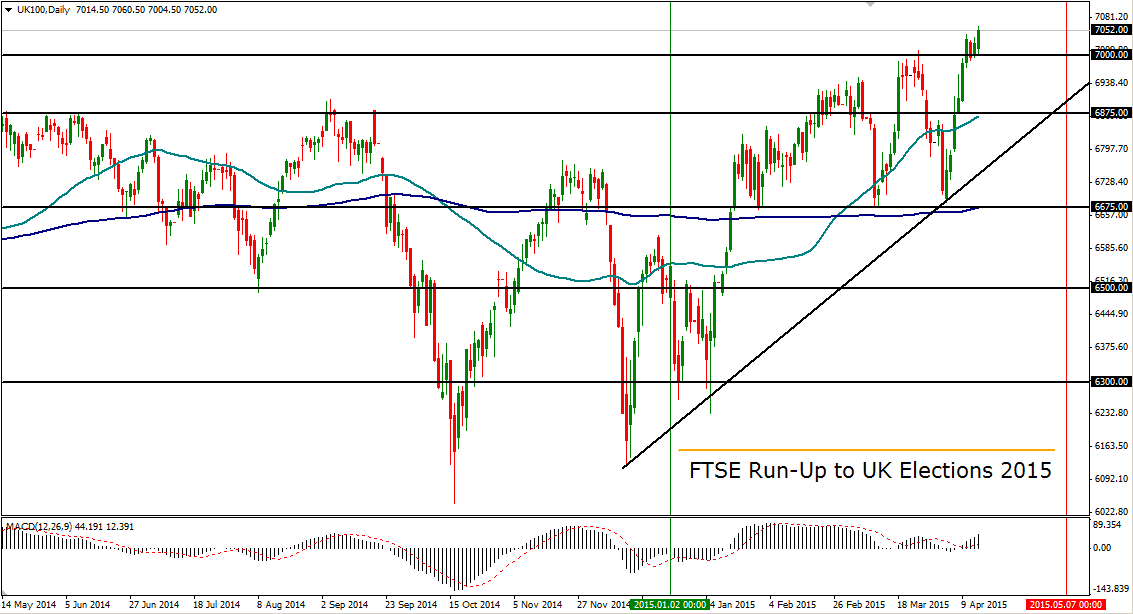
Much like in 2010, the FTSE 100 run-up to mid-April before the May 2015 elections has been strong. In the current scenario, however, the index has just hit a new all-time high as of April 15th, just slightly higher than the previous all-time high of 7044 that was just reached only three trading days earlier.
Much of March’s price action for the FTSE has been choppy, but the first half of April saw an exceptionally steep incline from a low of 6685 on the 1st of April up to the noted all-time high around 7060 as of mid-April.
If the current market is to repeat its 2010 run-up to the elections, where a peak was reached in mid-April before a subsequent plunge as the elections approached, the FTSE could soon be poised for an impending pullback and decline after having overextended to the upside.
If this is the case, major downside targets reside around the 6875 and then 6675 support levels. Any further drop could prompt a short-term return to the 6500 support level or lower.
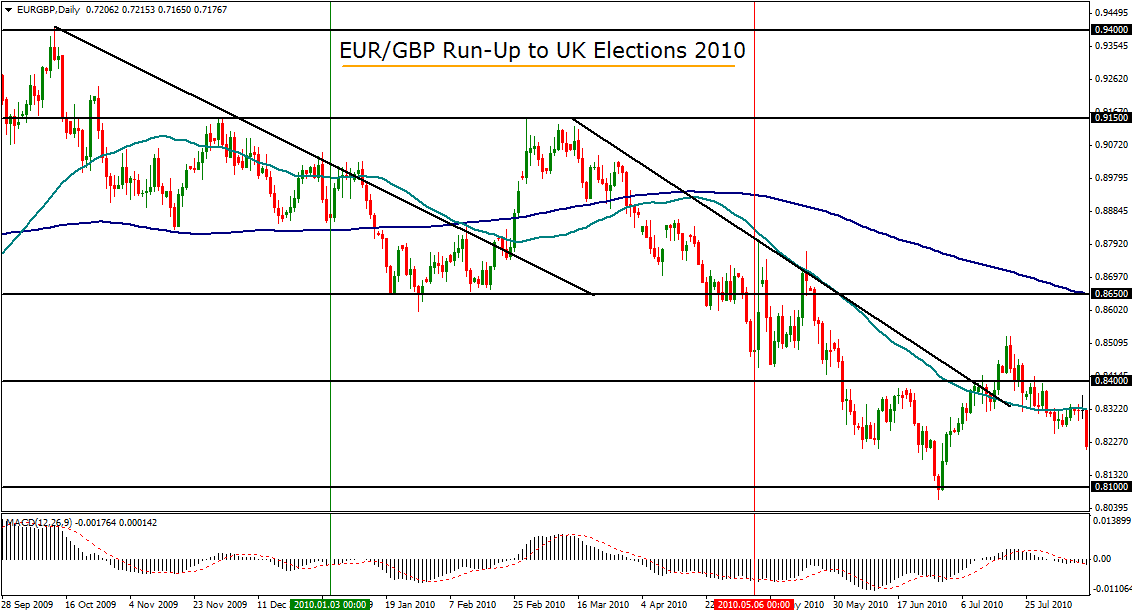
The British pound was in strengthening mode against the euro, in contrast to its simultaneous weakening against the US dollar, during the run-up to the 2010 UK elections.
The EUR/GBP currency pair began to tumble from the beginning of March 2010 from its major resistance high around 0.9150.
The decline in the currency pair (which represented a rise in sterling) lasted from March all the way up to the May elections, and continued after the elections until a temporary bottom was hit slightly below 0.8100 support at the end of June 2010.
After that June bottom was established, EUR/GBP began a choppy rise (which represented a decline in value for sterling) that culminated a year later when the currency pair topped out in July of 2011 at 0.9082, a level that has not been reached again since then.
In summary, EUR/GBP was in general decline during the run-up to the May 2010 elections, and continued to decline for around two months after the elections until it bottomed out and began to rise in late June 2010. This signified a strengthening of the pound against the euro before and shortly after the 2010 UK elections, followed by a subsequent trend reversal.
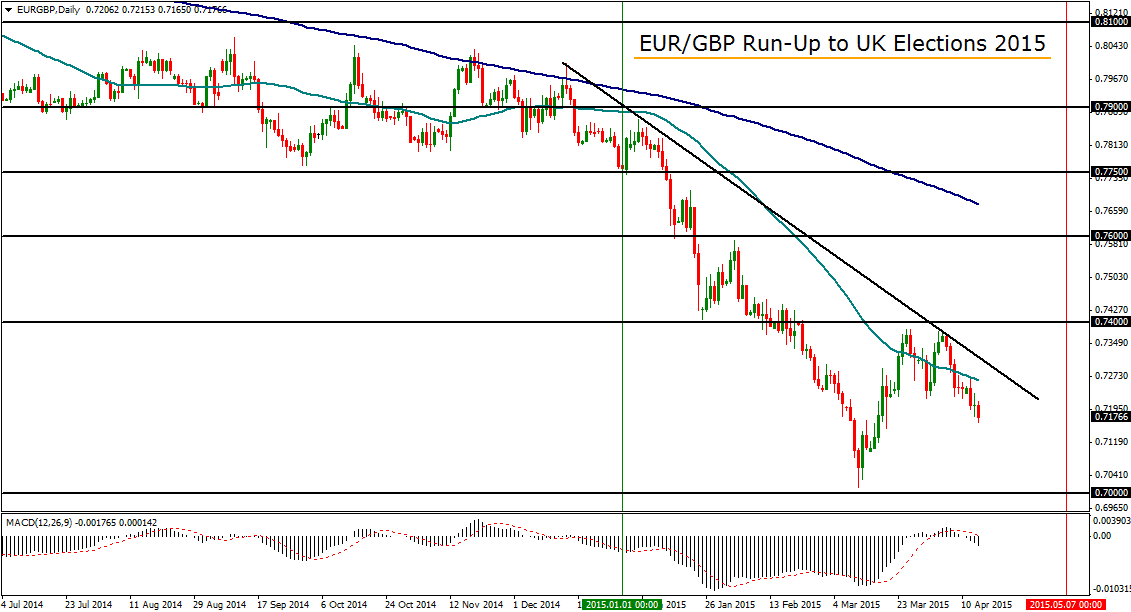
Somewhat similar to the price action during the 2010 elections, but in a sharper manner, the EUR/GBP chart in the run-up to the upcoming 2015 UK elections has shown significant declines.
In the case of 2015, the currency pair has been in a sharp plunge since the beginning of the year. A new seven-year low of 0.7013 was hit in early March, just slightly above its downside support target of 0.7000.
Despite a sharp bounce up to form a double-top high just short of 0.7400 resistance during the latter half of March, the currency pair continues to be pressured to the downside. The first half of April has seen a sharp retreat after the rebound and a potential resumption of the downtrend.
Going into the 2015 elections, the trend is decidedly bearish, which potentially represents continued sterling strength against the euro. The most important downside target remains at the noted 0.7000 support level.
Any breakdown below 0.7000 could begin to target the 0.6900 and 0.6800 objectives further to the downside after the elections.
Any subsequent bounce should meet continued strong resistance around 0.7400 and then 0.7600.
