Markets have now reached resistance targets
After several weeks of anticipation the bulls have managed to lift the markets above the upside resistance targets with last week’s price action. Several factors […]
After several weeks of anticipation the bulls have managed to lift the markets above the upside resistance targets with last week’s price action. Several factors […]
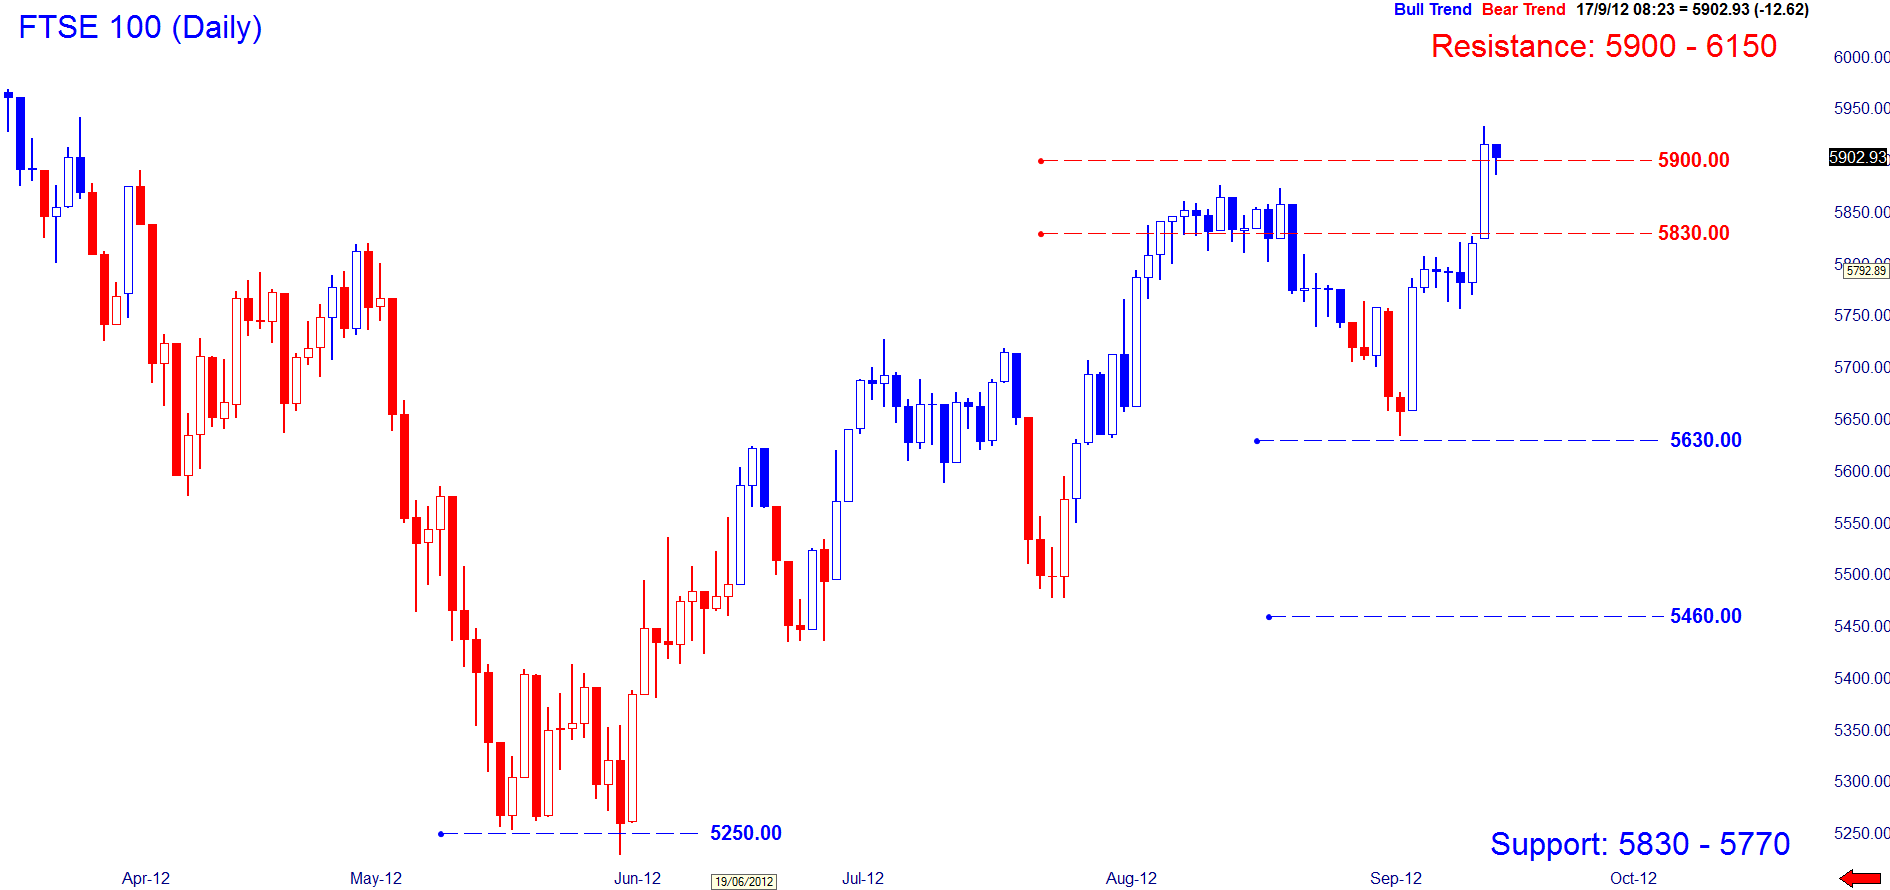
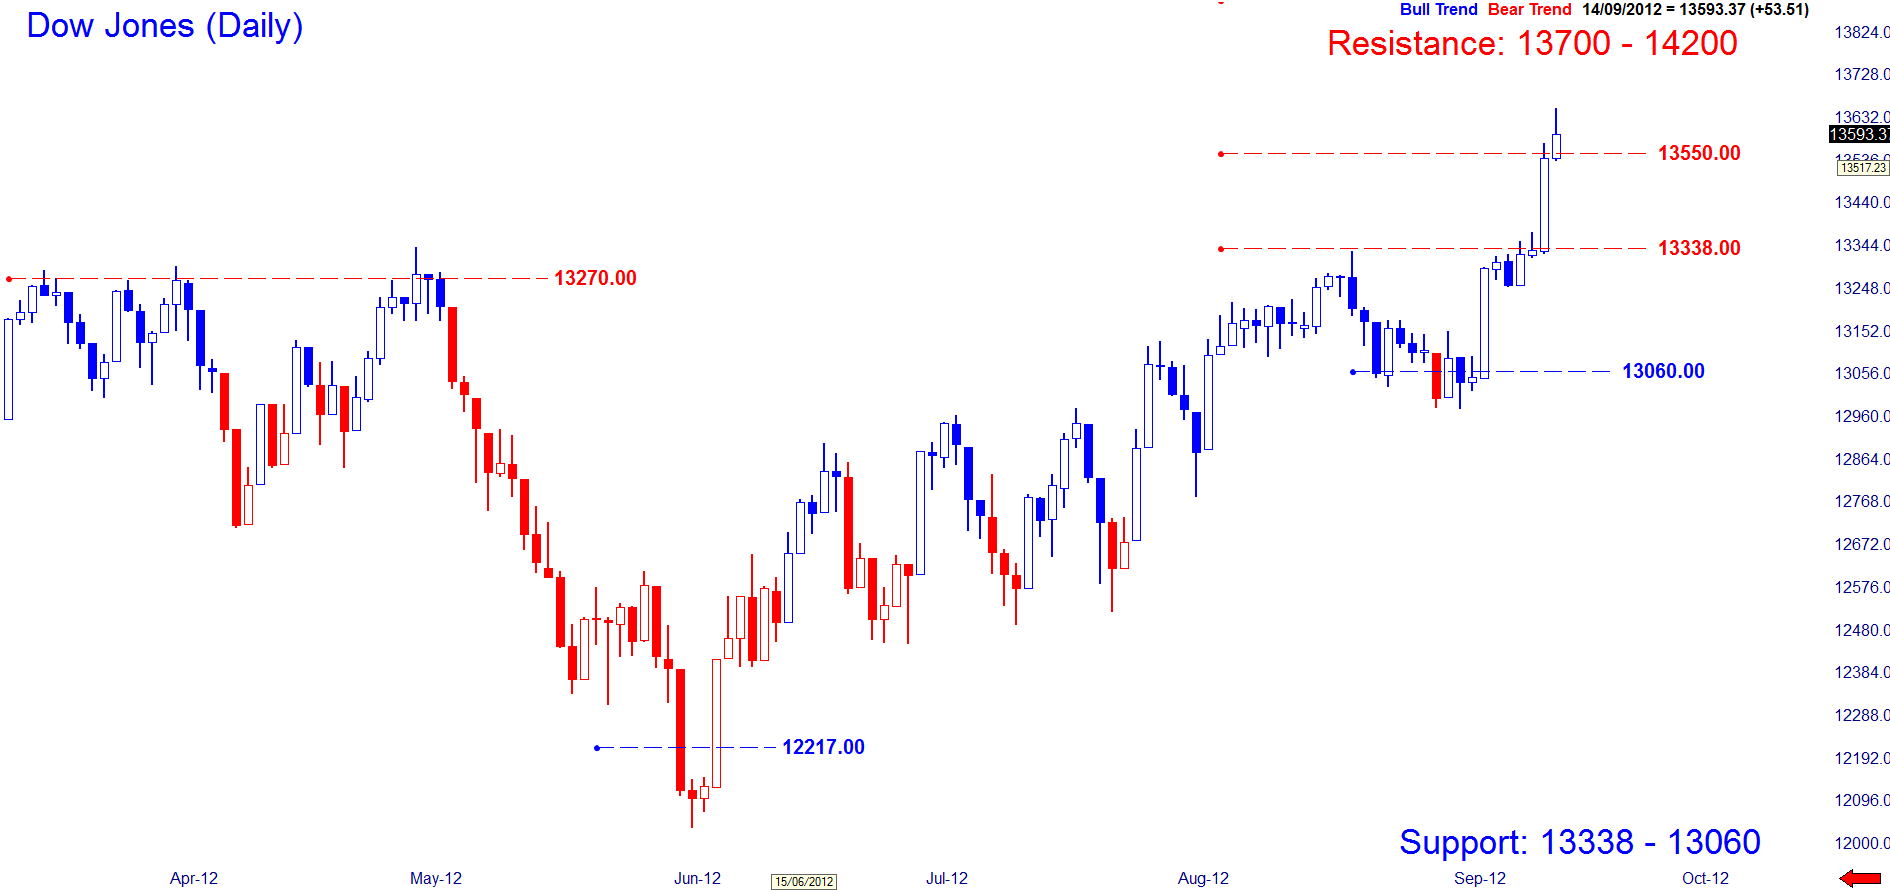
After several weeks of anticipation the bulls have managed to lift the markets above the upside resistance targets with last week’s price action. Several factors are in play for the bulls at least for the short term. The momentum had shifted to the bullish side on September 6th for the FTSE 100 and August 31st for the Dow Jones. Since the reversal the indices have successfully managed to reach the upside objectives with the potential for higher prices in store. But for the short term a pullback should not be ruled out as the lower time frames suggest the markets may be over extended. See key levels below:
FTSE 100 key objective at 6000
Last Friday’s price action suggest that after the strong Thursday move we see a potential for a pullback. This is if the index manages to break below 5886. If this scenario occurs then the downside objective could rest at 5830 which has been the previous resistance level. If we see the index find support here then the opportunity to see 6000 – 6150 could be viable. Momentum remains bullish and hence pullbacks may see buyers stepping in. The alternative scenario is that the index holds strong and continues past Thursday’s high of 5932 to move straight towards the 6000 target.
Dow Jones next objective at 13700
A price rejection at 13653 which is shy of 13700 as a technical price target took the index to close away from its high on Friday last week. If this week sees the Dow Jones hold onto a positive tone then the next upside target resides between 13700 – 13850 and the key objective being the all time high October 2007 high of 14198. The close of September should aim to hold above 13270 if the index is to continue towards the key targets. Short term the index will need to stay above 13338 which may also act as a support as we had seen this as a previous resistance level. Momentum remains bullish on several timeframes.
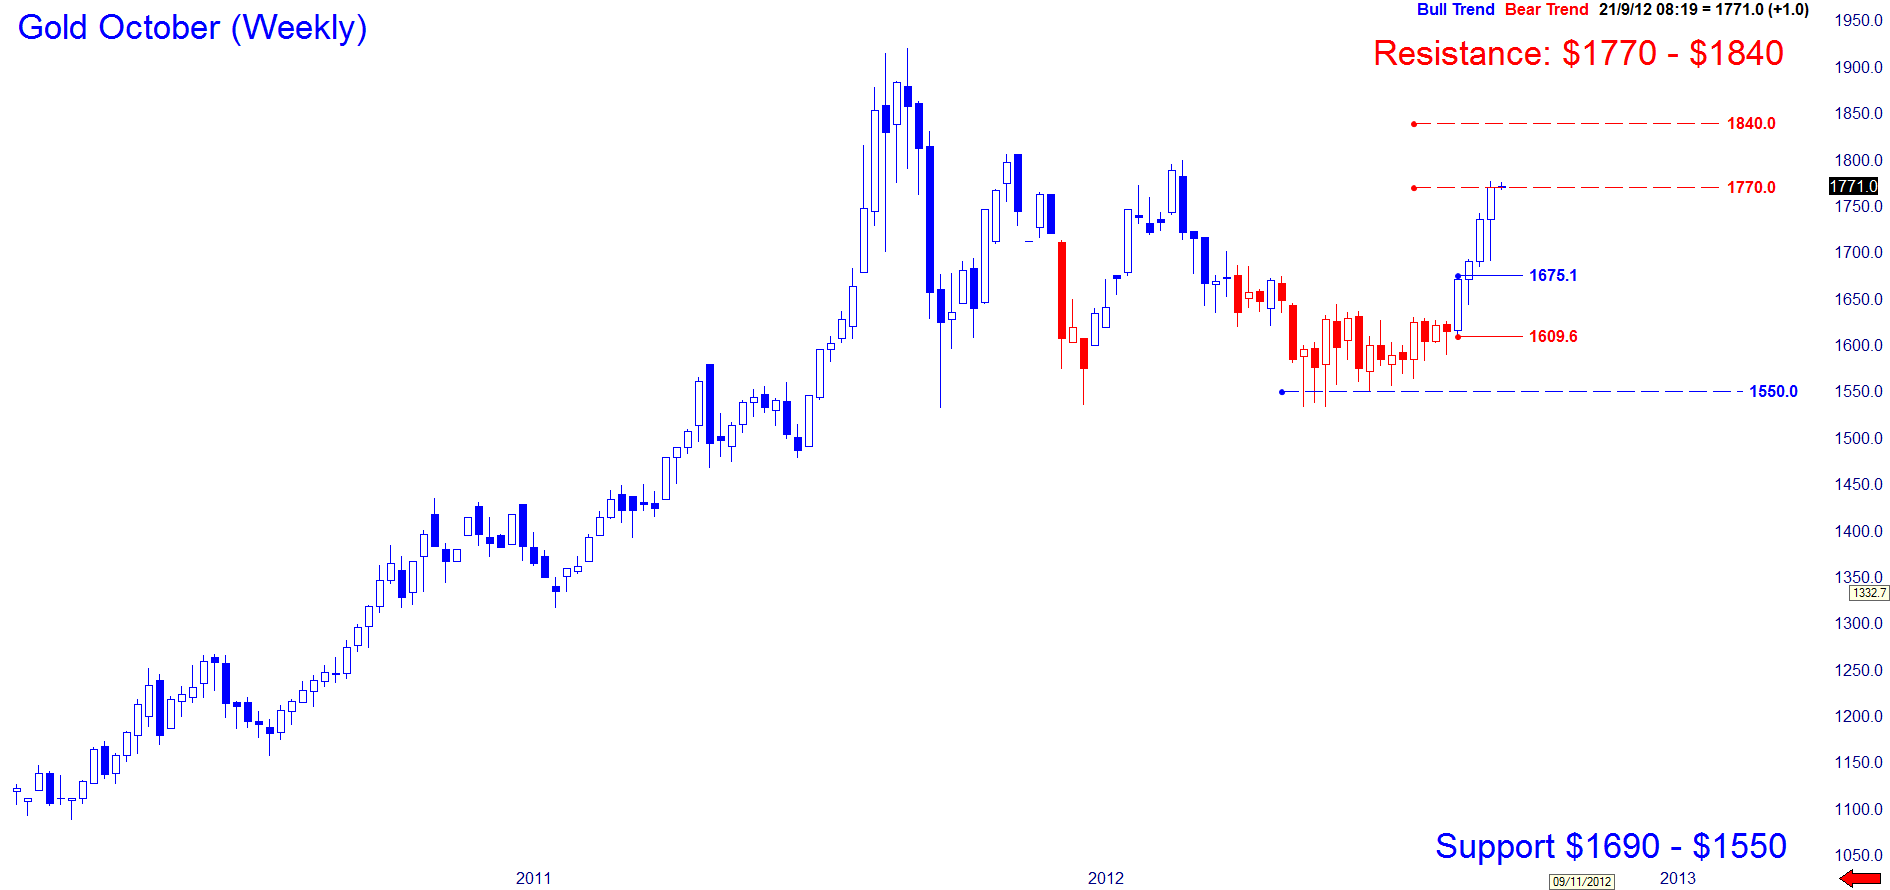
Gold reaches initial target of $1,770
After the break of $1,675 gold has managed to maintain its upward bias and reached its first objective of $1,770 with ease. As long as gold does not break below $1,609 over the coming weeks then we may see the bullish trend remain in force and take the metal higher to $1,840 as the secondary target. But the Weekly chart has seen the commodity trade sideways since September 2009 and until a clean breakout has taken place either above $1,920 or below $1,530 there could still be a range bound trading activity but with a bullish bias. For now though gold will need to clear above $1,806.