View our guide on how to interpret the FX Dashboard


View our guide on how to interpret the FX Dashboard
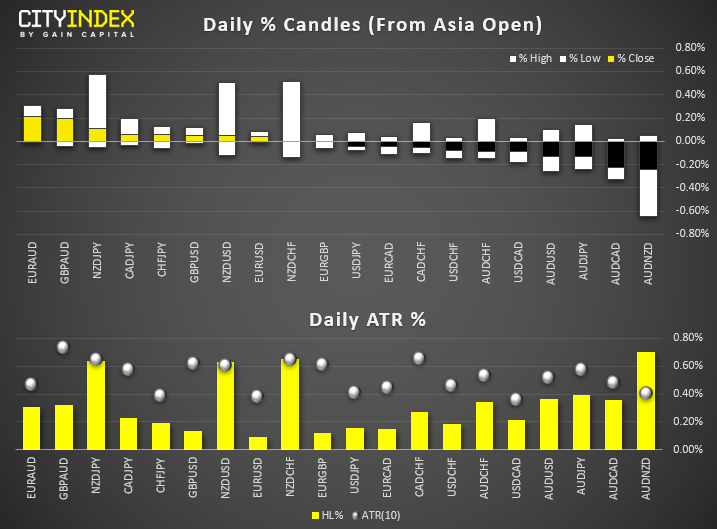
FX Brief:
- Australian retail sales went nowhere in October. A big fat 0%. Nil. Exports also slumped to -5% versus +3% expected and private house approvals also fell -7%. Considering yesterday’s weak GDP, it’s not a great end to the year data-wise after RBA held a relatively optimistic view in Tuesday’s statement.
- Japan officially launched their economic stimulus package, which is expected to boost GDP by 1.4% according to ‘sources’ from the government. If growth is to remain as elusive as CPI, which has missed target for several years now, let’s not hold our breath. Chances are BOJ will go further into negative rates net year.
- RBNZ Governor Orr signalled that rates are on hold in February. Given the slew of better-than expected economic data and fiscal stimulus unveiled by the government, upside potential for NZD pairs remains favourable as we enter 2020.
Price Action:
- DXY remains under pressure, although yesterday’s low found support at the monthly S1 pivot yesterday, and today’s action is finding support around the 200-day eMA. So perhaps the downside pressure are easing off, ahead of tomorrow’s NFP report. (Unless today’s OPEC meeting says otherwise).
- EUR/USD printed a prominent bearish pinbar and closed below 1.1100 to warn of a bull-trap. Near-term bias remains bearish below 1.1100.
- USD/CAD sits precariously on 1.3215 support ahead of today’s OPEC meeting. Judging from the bearish momentum which slammed prices down here, path of least resistance appears to be lower.
- GBP/USD is sitting pretty at its 7-month high, after breaking out of its inverted head and shoulders pattern yesterday. Whilst the pattern projects a target around 1.3200, we’d prefer to see at least a minor pullback and target 1.3177 resistance first. Bias remains bullish above 1.3000.
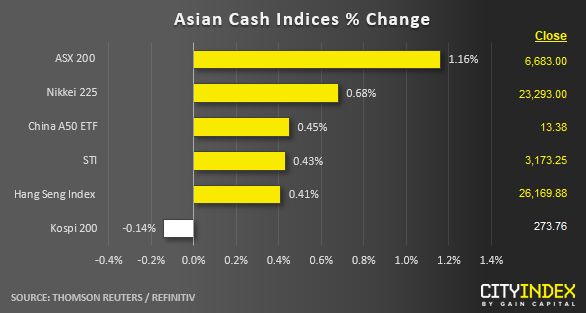
Equity Brief:
- A relief rebound has taken shaped in key Asian stock markets today after two session of consecutive losses. The catalyst for the rebound has been another “optimistic” trade related headline as per reported by Bloomberg in yesterday’s European session that stated U.S and China are getting closer to a deal that would avoid additional tariffs to be implemented on 15 Dec. In addition, U.S. President has been quoted saying that trade discussions with China are going very well.
- In the short-term, trade related headlines will be the main driver that determine the intraday swings until more clarity can be determine on the details of the Phase One trade deal.
- One of the best performers is from Japan’s Nikkei 255 which has recorded a gain of 0.68% so far that has been reinforced by the Japanese government’s latest fiscal stimulus plan amounting to 13 trillion yen to support stalling growth.
Price Acton (derived from CFD indices):
- Japan 225: Broke above the minor descending trendline from 02 Dec 2019 high and transited back into a minor churning phase within a medium-term sideways range configuration in place since 07 Nov 2019 with its range resistance at 23650. Short-term supports now rest at 23150 follow by 22980 next (yesterday’s swing low area).
- Hong Kong 50: Minor downtrend remains intact with key short-term resistance at 26300. A broke below 25950 (yesterday’s low) reinforces a further down move to test the next near-term support at 25660/500 (28 Sep/10 Oct 2019 swing low.
- Australia 200: Minor mean reversion rebound in progress with key short-term support now at 6630 (former 21 Nov 2019 minor swing low) that has been broken to the upside. Next intermediate resistance stands at6740/6780 (50%/61.8% retracement of the recent decline from 29 Nov high to 03 Dec 2019 low).
- Germany 30: Continued to churn within a medium-term sideways range configuration in place since 19 Nov 2019 with its range resistance at 13350. Near-term supports to watch will be at 13070 and 12980 (02/03 Nov 2019 swing low areas).
- US SP 500: Yesterday’s rebound from the 3070 low of 03 Dec has stalled at the 61.8% Fibonacci retracement of the recent decline from 02 Dec high to 03 Dec 2019 low and the 3122 minor swing high area of 02 Dec, European session. A break below 3090 reinserts the bearish tone while a clearance above 3122 see a further push up to retest the all-time high area at 3155.
Matt Simpson and Kelvin Wong both contributed to this article
Data from Refinitiv. Index names may not reflect tradable instruments and not all markets are available in all regions.Latest market news
Today 01:15 PM
Latest Dollar articles
February 16, 2024 11:30 AM
February 7, 2024 03:30 PM
February 2, 2024 02:00 PM
January 26, 2024 03:00 PM