Market analyst predictions for February 2015
In the first of our monthly predictions features, our global analysts – including Ashraf Laidi, James Chen and Joshua Raymond – pick out their predictions […]
In the first of our monthly predictions features, our global analysts – including Ashraf Laidi, James Chen and Joshua Raymond – pick out their predictions […]
In the first of our monthly predictions features, our global analysts – including Ashraf Laidi, James Chen and Joshua Raymond – pick out their predictions on GBP/USD, USD/JPY, gold and much more.
Is there a market you’d like to see that isn’t currently covered? Tweet us at @Cityindex and we’ll include the market you requested in next month’s feature.
| Analyst | Market | Bias | 1st target | 2nd target |
|---|---|---|---|---|
| Ashraf Laidi | GBP/USD | Bullish | $1.5420 | $1.5580 |
| After posting seven consecutive monthly declines – the longest losing streak since the 2008 crisis – GBP/USD is set to rally in February. Read more | ||||
| Ashraf Laidi | USD/JPY | Bearish | Y115.30 | |
| As long as bond yields remain dragged by traders’ preoccupation that the Fed’s hawkish intentions would risk deflation and endanger growth, the Japanese currency continues to gain. Read more | ||||
| Ashraf Laidi | Gold | Bearish | $1,220 | |
| The inverse USD-gold relation continues to be challenged. Read more | ||||
| James Chen | EUR/USD | Bearish | $1.11 | $1.08 |
| The sharp declines throughout the month of January were an extension of the currency pair’s already entrenched bearish trend that goes back to May of last year. Read more | ||||
| James Chen | Nymex crude oil | Bearish | $44.00 | $38.00 |
| While the spike at the end of January was encouraging and suggested a possible bottoming, the move was considered mostly technical, as the fundamentals of increasing supply and waning demand have changed only modestly. Read more | ||||
| James Chen | S&P 500 | Bearish | 1880 | 1800 |
| With the US equity indices still not far off from their record highs, and significant declines seen throughout January, February could see a further pullback and even a potential correction in the S&P 500. Read more | ||||
| Ken Odeluga | FTSE 100 | Bearish | 6730 | 6560 |
| The FTSE 100′s recent run has taken it about 70 points from all-time closing highs, fuelled by blue-chip earnings, which were fair, but don’t justify the FTSE’s strength. Especially in view of weakening retail sales and slowing earnings growth. Read more | ||||
| Ken Odeluga | S&P 500 | Bearish | 2055 | 2035 |
| S&P 500 is not a picture of strength, despite its comeback of about 3% in the second half of last week. It’s doubtful the market currently has enough momentum to tackle formidable resistance nearby. Read more | ||||
| Joshua Raymond | FTSE 100 | Bearish | 6660 | 6580 |
| Near term, the FTSE 100 technically doesn’t look too great right now. It faces resistance when attempting to break above levels 6860 and 6900, which has historically proved to be a strong psychological barrier to price growth above these levels. Read more | ||||
| Joshua Raymond | GBP/USD | Bearish | $1.5220 | $1.5000 |
| I am still a strong believer of the fundamental play with this forex pair. The Bank of England is cooling interest rate talk and I don’t foresee any rate hike until Q1-Q2 2016 at this present moment. Read more | ||||
| Joshua Raymond | Tesco | Bearish | 210p | 205p |
| In the long term, I remain convinced of the Tesco recovery story but to cement that, I would like to see Tesco shares trading back above the 250p level. Read more | ||||
| Joshua Raymond | Pepsico | Bullish | $98.50 | $100.00 |
| Stock is nearing trendline support levels. Read more | ||||
| Kara Ordway | AUD/USD | Bearish | 0.7626 | 0.7626 |
| The fact that the rate cut from China couldn’t push the Australian Dollar higher tells a pretty clear story that it doesn’t want to trade higher. Read more | ||||
| Kara Ordway | AUD/NZD | Bearish | 1.05 | 1.0420 |
| For the moment, it looks like we should see the RBA move another cut in June. As this speculation increases, AUD/NZD should start to head lower. Read more | ||||
| Kelvin Wong | DAX | Bearish | 10,400 | 10,040 |
| The current intermediate-term bullish trend in place since the 16 October 2014 low appears to be ‘overstretched’. Read more | ||||
After posting seven consecutive monthly declines—the longest losing streak since the 2008 crisis, GBP/USD is set to rally in February, partly on receding expectations of a 2015 Fed rate hike and improving figures from the UK. While GBP’s gains are still considered as corrective, upside could extend towards and beyond the 55-day moving average of $15420, extending to 1.5580.
The combination of reduced market expectations of a 2015 Fed hike and Japan’s inability to hammer out pay rises to assist the Bank of Japan in reaching its 2.9% inflation target will continue to work against the pair. Despite all the headlines about USD strength, the Japanese yen has been the clear winner among the top-traded 11 currencies, outperforming the USD year, falling second only to the Swiss franc.
As long as bond yields remain dragged by traders’ preoccupation that the Fed’s hawkish intentions would risk deflation and endanger growth, the Japanese currency continues to gain due to Japan’s role as the world’s largest provider of capital. Another retest of 115.30s is on the cards.
The inverse USD-gold relation continues to be challenged. Gold’s recent rally failed at the two-and-a-half year trendline resistance of 1310, which coincided with the 100-week moving average. The metal outperformed during the dovish surprises from the Bank of Canada, Reserve Bank of Australia and Monetary Authority of Singapore. We expect a temporary pullback towards 1220s, before stabilising back near the 1250s.
EUR/USD saw major declines throughout the month of January as the currency pair dropped from above the 1.2000 level in the beginning of the year down to a new 11-year low around 1.1100. This plunge was helped by both the continued strength of the US dollar as well as the ECB’s quantitative easing announcement in late-January that contributed to the euro’s further weakening.
The sharp declines throughout the month of January were an extension of the currency pair’s already entrenched bearish trend that goes back to May of last year. Having recently hit its 1.1100 downside target, EUR/USD could very well see further declines in February. A breakdown below 1.1100, which would confirm a continuation of the entrenched downtrend, should then begin to target the 1.0800 level on its way towards a potential longer-term objective around parity (1.0000).
The last trading day of January saw a substantial rebound of around 8% in US crude oil, which represents the West Texas Intermediate (WTI) benchmark for light sweet crude. This significant jump occurred a day after the embattled commodity dropped to a fresh five-year low well below 44.00, signaling a new and troubling extreme.
While the spike at the end of January was encouraging and suggested a possible bottoming, the move was considered mostly technical, as the fundamentals of increasing supply and waning demand have changed only modestly. This change comes mostly from the US, as it has begun to scale back on new projects and exploration in the face of plunging oil prices.
If other major oil players continue to maintain high production levels, February could potentially see further declines in oil prices into the low 40’s and possibly the high 30’s before potentially bottoming out further into the year. The 35.00 level continues to serve as the most important major support level to the downside in the event of a further drop.
Although the major European equity indices generally saw a substantially positive January, US indices fared much worse. The S&P 500 dropped from its new record high around 2090 in the last few days of 2014 down to a low below 2000 by the last trading day of January.
With this drop, the benchmark index has once again revisited its 200-day moving average to the downside and provided some ominous indications of what could potentially occur in February.
With the US equity indices still not far off from their record highs, and significant declines seen throughout January, February could see a further pullback and even a potential correction in the S&P 500.
A correction is generally considered a decline of 10% or more, which has not happened since the sharp plummet of September and October of last year. A similar 10% correction from the recent 2090 record high would bring the index down to around the 1880 level. Below that, any further correction should meet major support around 1800.
The UK’s FTSE 100 has belied fears that it might succumb to a host of impediments in 2015 and is off to a cracking start to the year.
After a marked slide into the last fortnight of 2014, which it did not fully recover from until the first uninterrupted weeks of 2015, the UK’s main equities benchmark has laid down a solid 6.5% gain on a year-to-date basis.
The weekly chart is reassuring.
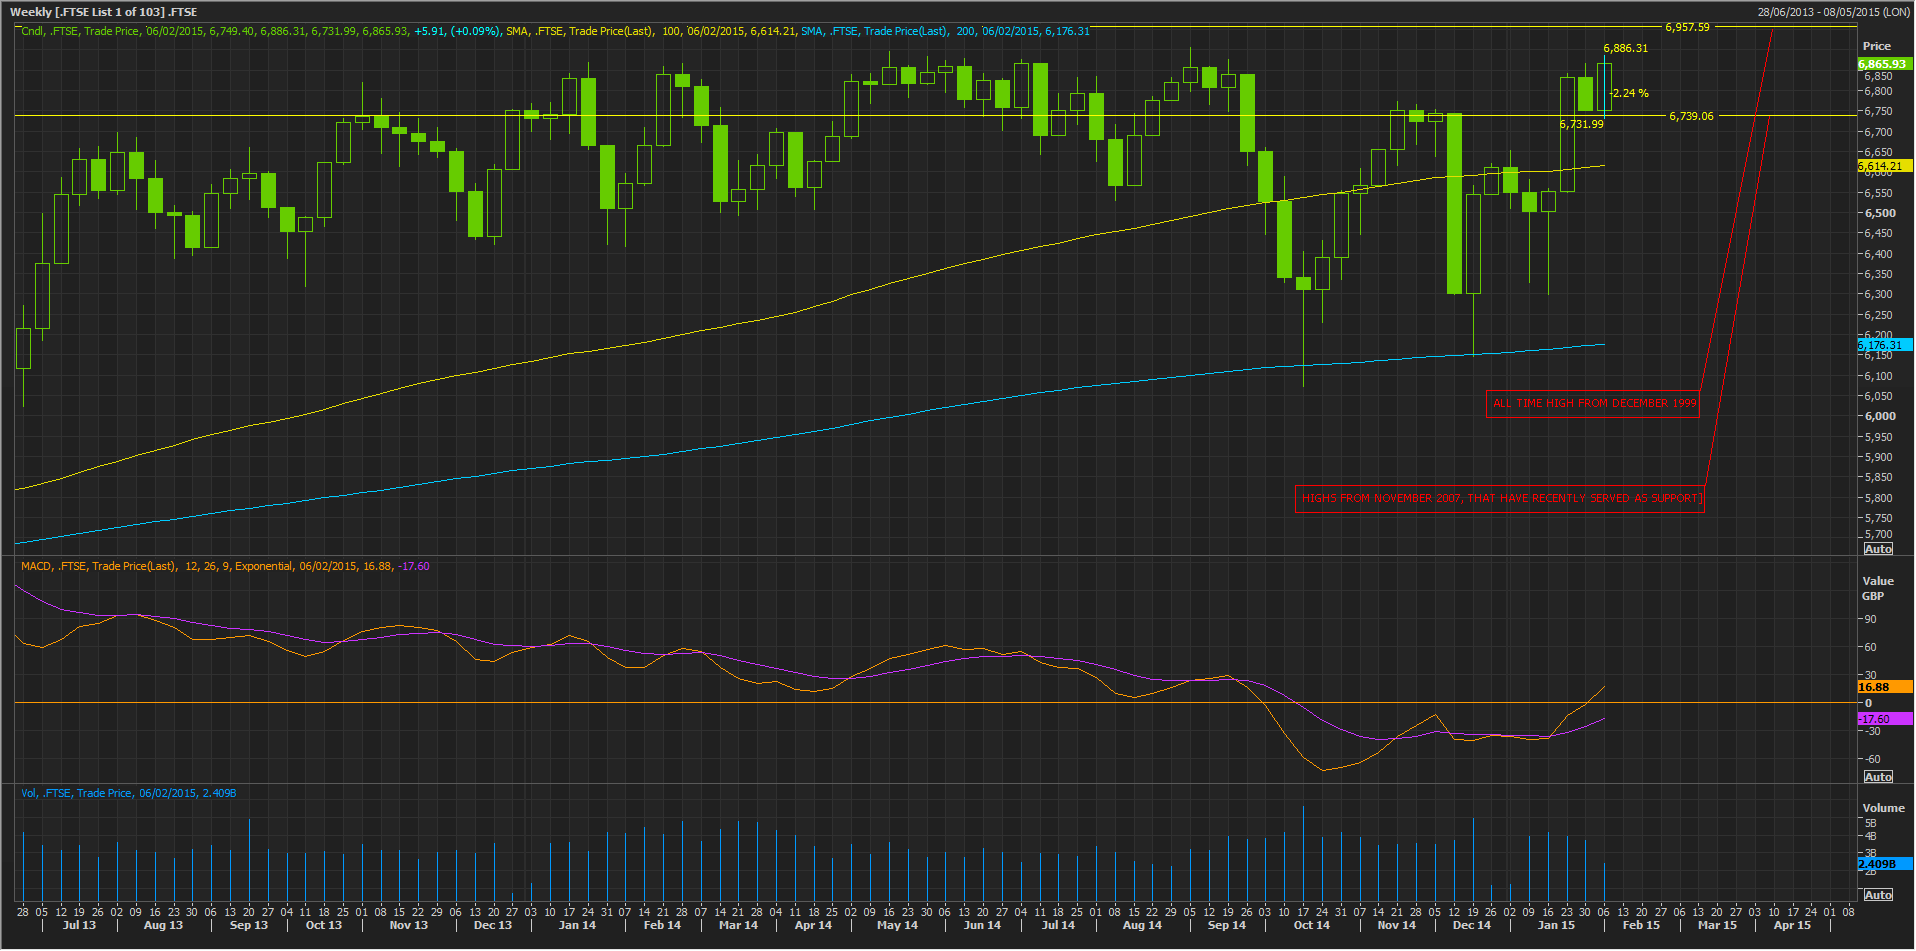
FTSE 100 is back above a long-term pivot that has provided solid support over the last few years.
One important contextual point is the currently on-going quarterly earnings season.
On an anecdotal basis, the index’s recent gains reflect that the market has been satisfied by earnings and revenue performance of FTSE 100’s constituents so far.
The wider context ought to include earnings performance by international firms too.
In view of the static-to-moderate decline in economic strength in most regions save for the US, not to mention for the sake of simplicity, we can try get a handle of the wider context by looking at the earnings performance of companies listed on the US’s broader benchmark stock index.
By market close on Friday 6th February, of the 322 companies in the S&P 500 that had reported earnings to date for Q4 2014, 73% beat analyst expectations.
This is above the long-term average of 63% and is above the average over the past four quarters of 69%.
The broadly assured trend by US firms is one factor underpinning the US benchmark S&P 500 stock index having edged 1% higher over the past month.
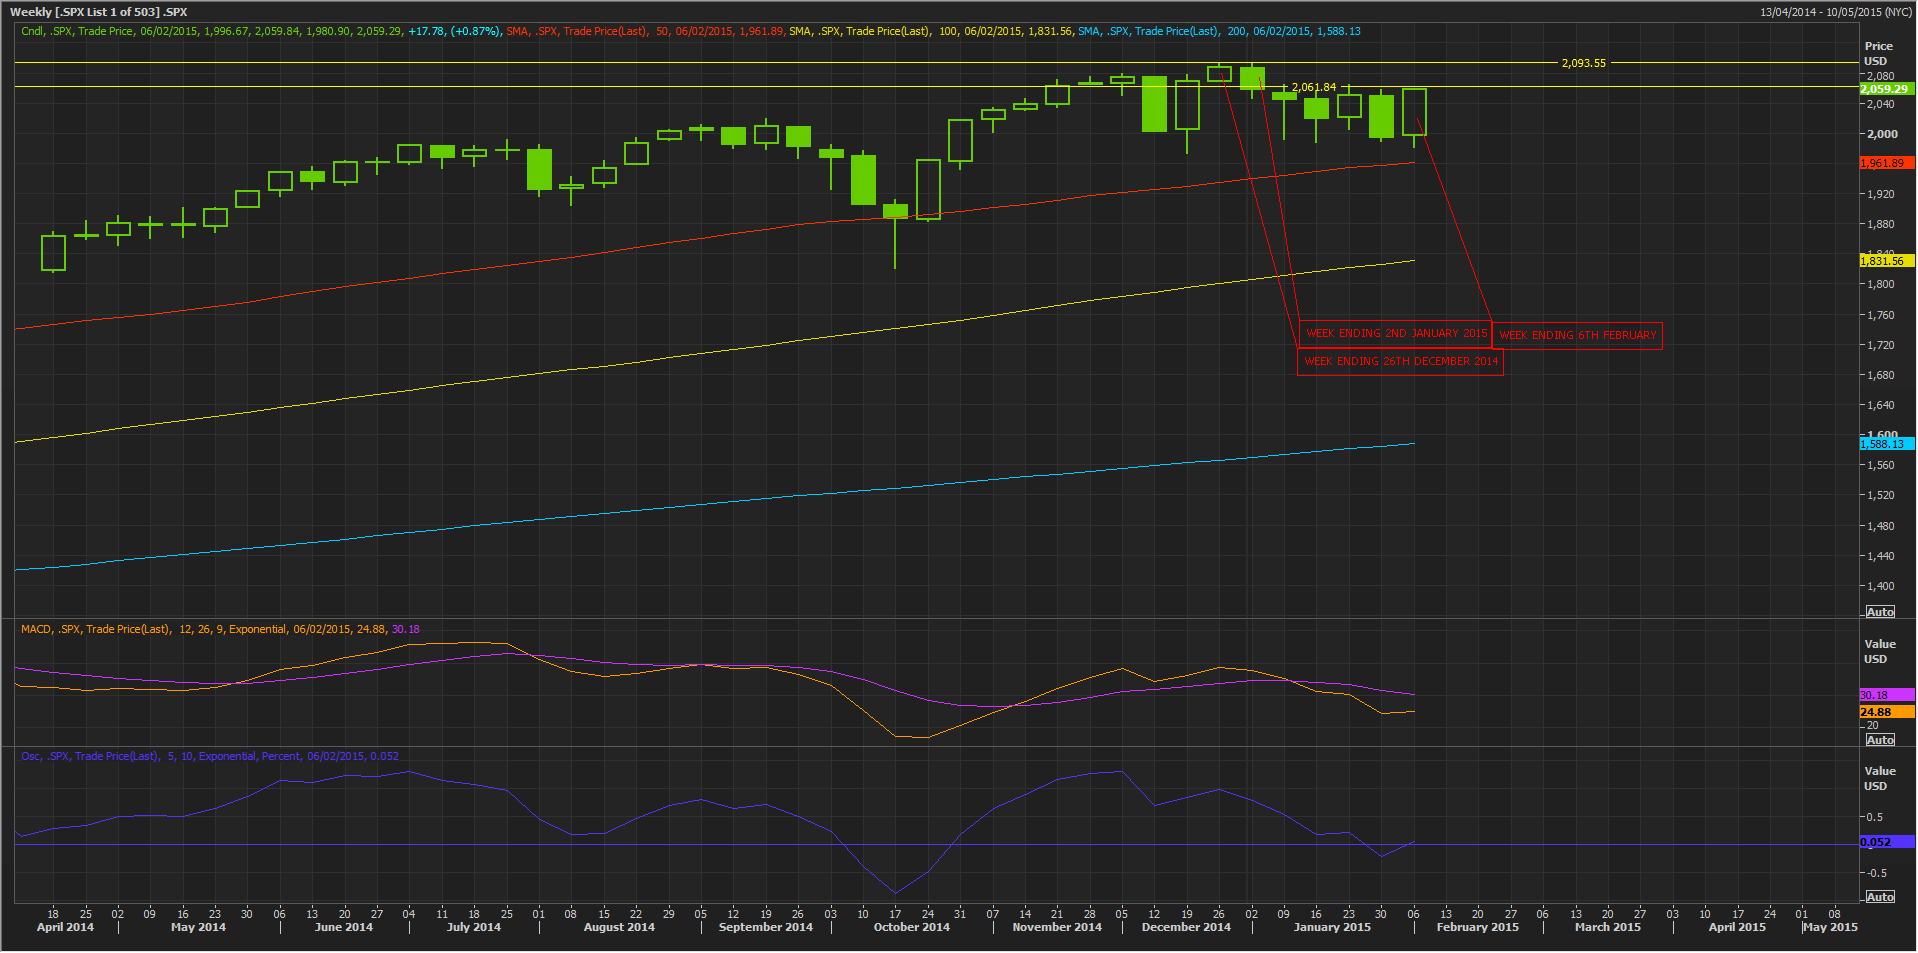
That has to be balanced by the fact that S&P 500 has actually fallen by the same amount since 1st January.
This ambiguous performance partly speaks to the fact that the US index remains close to all-time highs, thereby implying, on the face of it, a reduced bias of chances for continued gains.
Also, many investors will be aware that during the third quarter, 75% of S&P 500 companies conducted share buybacks, with a similar trend likely to be seen in 2015, suggesting at least some of their share price rises, and in turn that of the benchmark index, can be attributed to share repurchases.
Unlike the FTSE 100, SPX has failed to break back above a ‘lower tier’ of resistance between current levels and record highs.
So we’re left with a FTSE 100 whose recent gains have taken it 71 points away from its best closing level ever, whilst its companies report moderately successful quarters.
The transatlantic context is an S&P 500 that is performing well in earnings terms, although admittedly, a significant portion of these corporate earnings are being reinvested in the stock market itself—which should be born in mind in considering the US market’s strength.
As for US share prices, it’s fair to say there’s been a broad, if moderate, retreat.
Returning to our main focus, the FTSE 100, a more sophisticated way of looking at earnings performance here is to look at achieved growth rates by FTSE 100 companies.
We can tweak our view of earnings growth further by annualising performance and basing it within a ten-year time frame.
For comparison it’s helpful to apply these calculations to both the FTSE 100 index and the price/earnings ratios achieved by its companies.
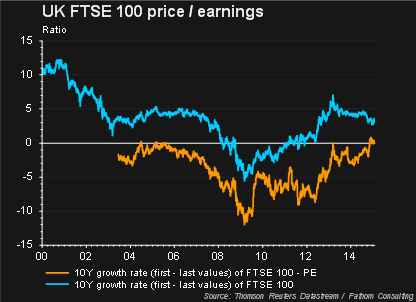
Doing this shows FTSE 100’s earnings growth recently peaked, whilst at the same time the FTSE 100 is in a moderate downtrend.
The convergence of the two is perhaps the most suggestive insight here.
In conjunction with the approaching FTSE 100’s all-time high and pause in the rise of the US benchmark, I expect a cautious undertone to become more obvious in sentiment over UK blue-chip stocks during the rest of February.
I do not expect investors to decide this month how much weight to press on the market from the over-arching influences of (still) weak crude oil demand, falling consumer prices, caution ahead of the UK’s general election, and uncertainty in the stagnant Eurozone economy from current negotiations between Greece and the EU.
The index should remain largely within its current range for the year-to-date of 6500-to-late-6800s, though the upper end seems likelier to prevail.
For a truly complete picture of the UK stock market outlook, we should not ignore the UK’s Main Street—headline economic flow.
For this I suggest we take a look at the consumer picture.
From a spender’s perspective things have improved, but from the corporate perspective, this isn’t as promising.
Price inflation has remained in the downtrend that it entered in 2012, whichever way we decide to cut the cookie.
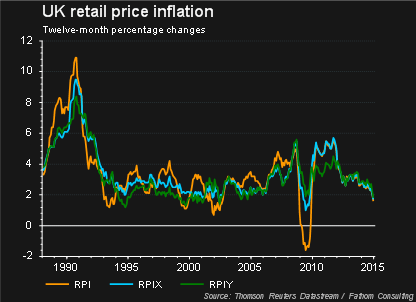
RPI- Retail Price Index (all items)
RPI- Retail Price Index (excluding mortgages and interest payments)
RPI- Retail Price Index (excluding mortgages and interest payments and indirect taxation)
Near term, the FTSE 100 technically doesn’t look too great right now. It faces resistance when attempting to break above levels 6860 and 6900 which has historically proved to be a strong psychological barrier to price growth above these levels.
This comes despite the fact that peer index the DAX has hit record high levels over the past few weeks. So, near term, the probability is for the FTSE 100 to suffer some minor correction back towards the 6500 level. There are of course fundamental factors behind this too.
The biggest weight on the FTSE is financial and oil stocks. Financial firms, such as HSBC, Prudential, Lloyds and Barclays have a combined 13.74% weighting on the FTSE 100. Oil firms BP, Shell (both ‘A’ and ‘B’ stock classifications) has a 12.78% weighting.
Combined, these six firms have a 26.5% weighting on where the FTSE heads. That’s a big majority. So it’s safe to say that happens to these firms over the next month will dictate what happens to the FTSE 100. It’s always worth reminding ourselves of this fact when trading the benchmark UK index.
Now that both BP and Shell are in post-results mode, investors will pay strict attention back to the price of crude oil, which has retraced back above the psychologically important $50 level.
Technically however, there remain significant concerns over the medium-term support for oil price growth and the recent recovery has the hallmarks of bargain hunting. A concerted move back above $60 a barrel for Nymex crude oil would change that perspective. For now, it’s too early to convince that an imminent oil price recovery is due and this takes one major supporting factor for BP and Shell away.
For banks, HSBC shares remain on a downward trend and shares are hitting resistance levels of below 630p, which seems timed well for a minor FTSE correction. A move back to 590p support levels looks possible at these levels. The one stock which seems counter-productive to my FTSE 100 perspective is Barclays, which has broken out to a new nine-month high and this break out needs to be monitored.
I’m still a strong believer of the fundamental play with this forex pair. The Bank of England is cooling interest rate talk and I don’t foresee any rate hike until Q1-Q2 2016 at this present moment.
The UK economic growth is slowing whilst deflationary pressure continues to make headlines, which will make the UK’s central bank less hawkish. The fact that recent hawks Weale and McCafferty both changed tact in calling for a rate hike is an important signal.
The Fed has so far refrained from talking down the hawkish side of their policy path, telling investors to remain patient in last month’s FOMC meeting. In this sense, I believe GBP/USD could soon re-test 1.50 once again.
I’m still hugely concerned over the medium-term outlook for the grocery sector as a whole.
The supermarket sector is in a structural decline, with intense price wars driving a race to the bottom on sales and by effect, margins. UK inflation is expected to drop into deflationary territory soon, mostly driven by the weaker oil price, but this raises more concerns on the UK grocery sector.
Tesco shares has outperformed in recent months, rising 27% in the last month alone (compared to the FTSE’s 7% growth over the same period), thanks to the warm reception of CEO Dave Lewis’s strategic plan. But this comes against the back drop of a share price which had almost halved towards the end of last year.
Long-term I remain convinced of the Tesco recovery story but to cement that, I’d like to see Tesco shares trading back above the 250p level.
The focus for Tesco is removing their gluttony of previous years. That means store closures, asset sales and a focus on margins, which is much needed and will be well received.
We also know that Tesco is in the process of investigating ways to sell all or parts of DunnHumby and so we can expect to hear more about how the firm will streamline in the coming quarters, which should be beneficial.
Right now, there is a possibility of short-term profit taking which could take prices back towards the 210p to 205p level.
Stock is nearing trendline support levels. Momentum remains fairly positive which breeds confidence that share prices could make another attack at the $99 and $100 levels. Trading with the trend here seem a high probability play.
AUD/USD and AUD/NZD to seek new lows as Central Banks try to keep up with the Joneses.
While in the past, FX market intervention and currency devaluation had a certain stigma to it, the past couple of months have seen a tsunami of Central Bank interventions to try and manipulate inflation and buoy economies.
FX volatility is soaring. And the problem lies with the fact that we are entering an era where this method of manipulation is the only tool left in the toolbox for many countries. Zero or even negative interest rates, combined with tight fiscal spending policies leave many Central Bank Governors with a tough job on their hands.
The unspoken currency war arena makes way for not only volatility in FX but consequences that stretch to businesses and individuals alike.
Locally, the Australian Dollar has come under pressure as the RBA cite falling oil prices and deflationary pressure as a reason for cutting rates to all-time lows in February. A push down to 7626 post cut may be a sign of things to come as the fundamental traders out there look for a slow grind lower heading into the second quarter of 2015.
But the technical traders out there sit on the other side of the fence. They look to a squeeze higher now (towards 8250) and point to short covering to make the reversal happen.
So what will move it?
Non–farm payrolls should create some excitement for the AUD/USD cross; with some recent miss matched data out of the US, this number should be an interesting one.
If it falls short on Friday those risk currencies like the Australian Dollar (and the euro, which has taken a significant tumble in recent days) should see some strength with the 8000 mark (and 11620 for euro) not out of the question.
It’s unlikely these affects will be long-lasting though. The fact the rate cut from China this week couldn’t push the Australian Dollar higher tells a pretty clear story that it doesn’t want to trade higher. Unless we see a considerable turnaround in commodity prices, February should be another weak one for the local unit.
Levels to watch:
Downside pressure should remain and there is a preference to trade cross rates when gaining exposure to AUD due to the confused AUD/USD positioning.
AUD/NZD downside pressure towards 1.05 / 1.0420 as divergence between the RBA and the RBNZ (who are still well ahead of the curve when it comes to monetary policy tightening – despite some dovish comments this week) becomes more apparent.
For the moment it looks like we should see the RBA move another cut in June. As this speculation increases AUD/NZD should start to head lower – did anyone say parity?!
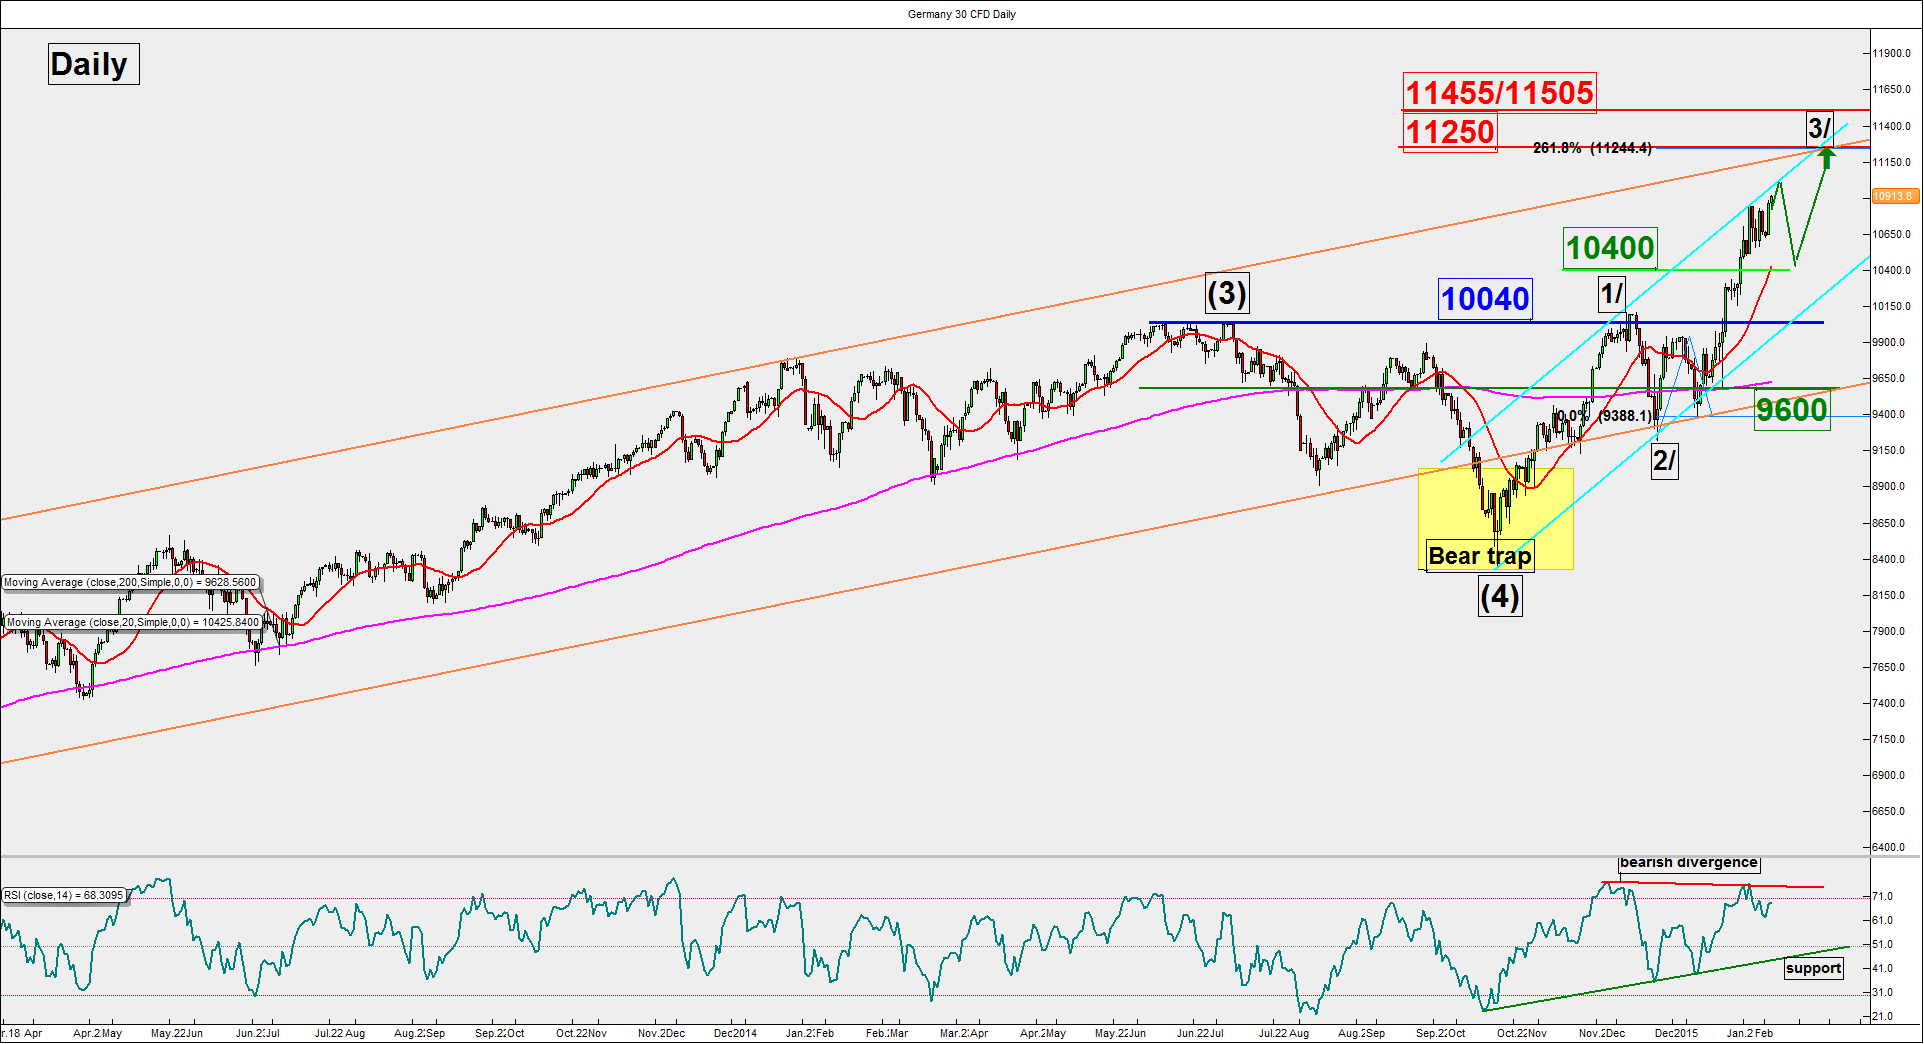
German DAX – Risk of a 3%-5% pull-back above 10400/10040 support before upside movement resumes
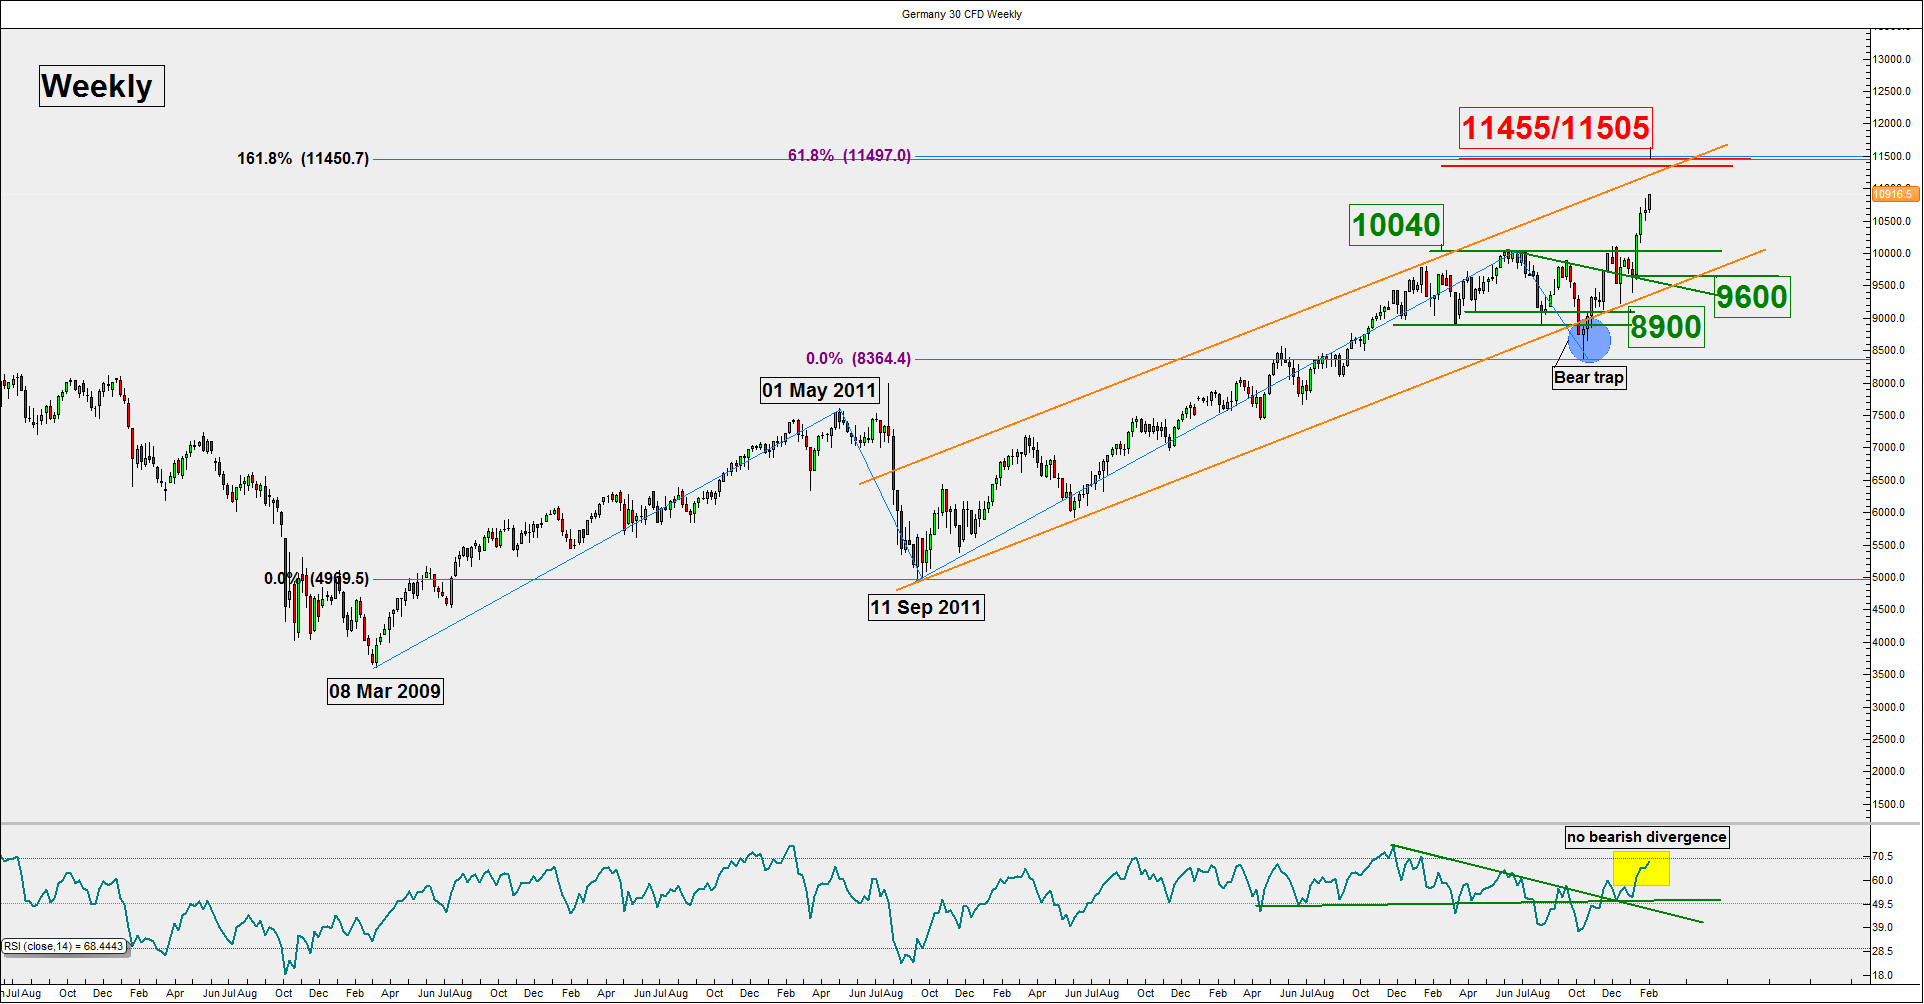
The German DAX has been the star performer in Europe as well as the rest of the world for the month of January 2015. This stellar outperformance has been reinforced by the European Central Bank, ECB firing its “Quantitative Easing” bazooka on the last monetary policy meeting held on 22 January 2015.
Going forward, what will be in store for the DAX? Let’s analyse its price structure from a technical analysis perspective.
Intermediate support: 10400
Pivot (key support): 10040
Resistance: 11250 & 11455/11505
Next support: 9600
The current intermediate term bullish trend in place since 16 October 2014 low appears to be “overstretched”. Therefore, we are expecting a possible pull-back in price action towards the intermediate support at 10400 with a maximum limit set at the key monthly pivotal support of 10040 before resuming its potential upside movement towards 11250 with a maximum technical target of 11455/11505.
On the other hand, failure to hold above 10040 may invalidate the intermediate term bullish trend for a decline towards the long-term support at 9600 (lower limit of the long-term ascending channel in place since 11 September 2011).
