


April 14, 2020 12:28 PM
Make It or Break It for The Australian Dollar
China reported a trade surplus for March earlier today at +19.90B vs -7.09B for the combined January-February period. China seems to be back in business after being shut down completely for 2 months. Additional data will be released later in the week. However, all eyes will now focus on if they can keep the coronavirus at bay, as a few flare ups have developed in a few areas.
Australia relies heavily on China as a trading partner. As such, as the economy of China goes, so does the economy of Australia. Traders have been anticipating China’s improved data for the last month as China began re-opening its factories and the economy. As a result, the Australian Dollar has been moving higher as well.
But now, pairs such as AUD/USD and AUD/JPY are at a point where they need to break though significant resistance to reach their previous February levels, or they will roll over and head lower.
On a 240-minute AUD/USD chart, the pair has broken out of a pennant formation, with a target near the March 9th highs and previous support (now acting as resistance) at February’s lows. However, price has stalled (at the less often looked) at 78.6% Fibonacci retracement level from the March 9th highs to the March 18th lows at .6433. In addition, this level happens to be horizontal resistance. The RSI is also in overbought conditions, however still pointing higher. If AUD/USD can break through .6450, price could run back up to prior highs near .6675. If price fails from here, support is back at the 61.8% retracement levef near .6234/.6250.
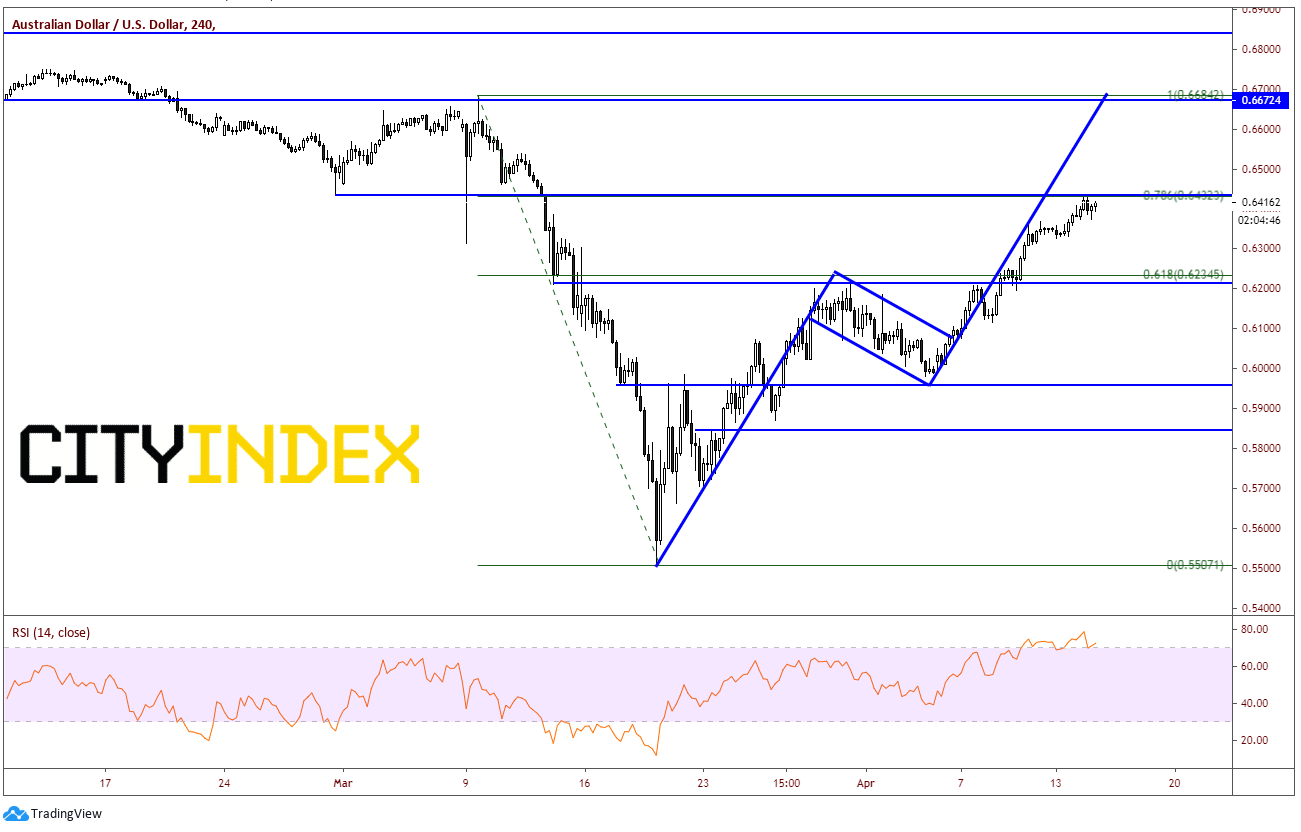
Source: Tradingview, City Index
On a 240-minute AUD/JPY chart, there is a similar pattern that has set up. Here, price has traded into the gap from March 9th and is up against horizontal resistance at 69.40. In addition, price has stalled at the 61.8% Fibonacci retracement from the February 20th highs to the March 18th lows. However, price has not yet filled the gap and is trading in an ascending wedge formation. If AUD/JPY can break higher and fill the gap near 69.75, price should be able to run up to horizontal resistance near 71.50 and then a full retracement up to 74.50. If price fails and breaks lower out of the ascending wedge, the target would be a long way down, back to 60.00! There will be a great deal of support along the way though, such as the upward sloping trendline and horizontal support convergence near 67.70 and horizontal support near 65.60.
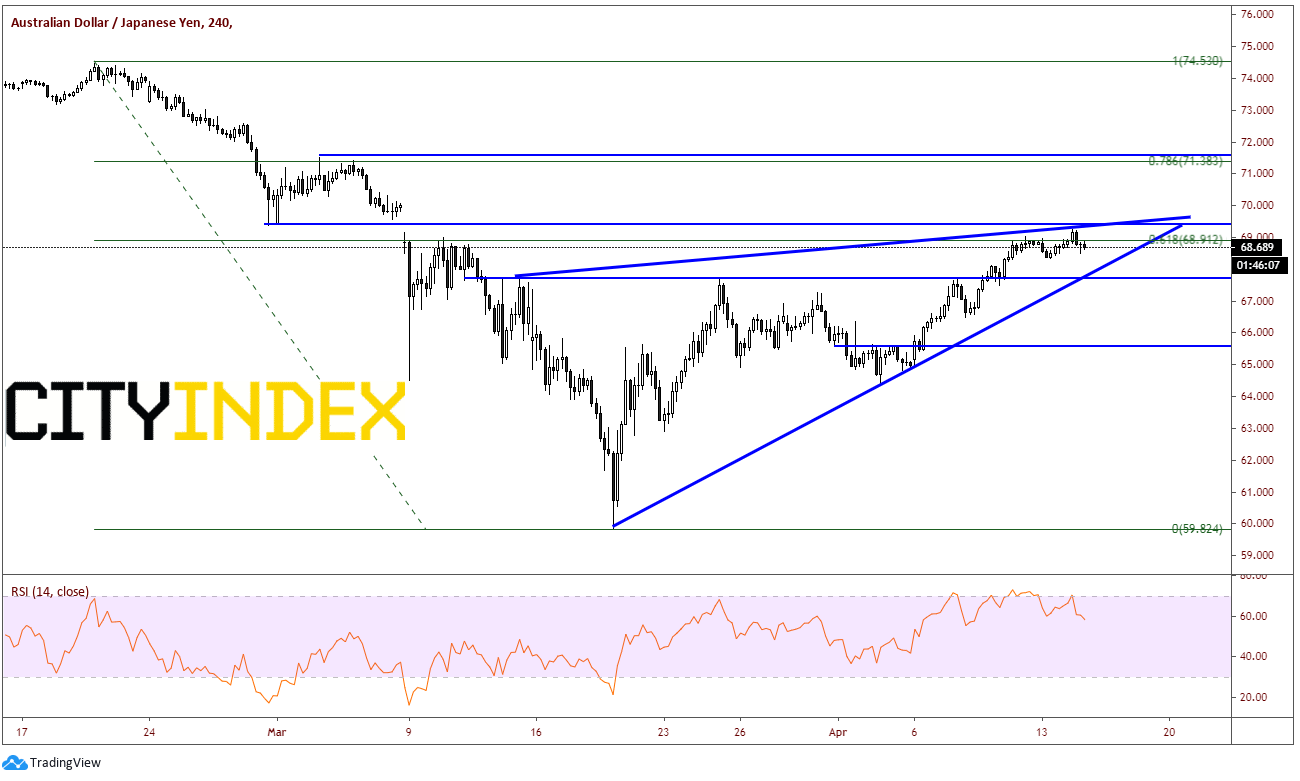
Source: Tradingview, City Index
The US is also discussing re-opening the economy. If that happens “sooner than later”, equities should also continue to climb, and bring AUD/USD with it. Watch both China and the US for new information regarding the coronavirus to help determine the next direction if the Australian Dollar!
Latest market news
Yesterday 03:00 PM
Yesterday 01:12 PM
Yesterday 11:14 AM
Latest USD articles
Yesterday 01:12 PM
April 24, 2024 01:23 PM
April 23, 2024 11:09 PM
April 23, 2024 11:01 PM