Key elements
- The upper and lower boundaries of the long-term ascending channel (in light blue) in place since 2nd October 2011 now stands at 2140/2170 and 1920/1900 respectively (see weekly chart).
- The pull-back support (in green) of the former long-term ascending channel in place since March 2009 is now at 1975 (see weekly chart).
- The 1920/1900 support also corresponds closely with the 23.6% Fibonacci retracement from the October 2011 low to the current February 2015 high (see weekly chart).
- The 2140/2170 long-term resistance also confluences with a Fibonacci cluster.
- The long-term RSI oscillator has continued to flash a bearish divergence signal and still has “room” for further downside potential before reaching its horizontal support (see weekly chart).
- Since early December 2014, the index is evolving within an ‘expanding wedge’ (in dotted purple) configuration with lower limit at 1980/1975 (see daily chart).
- The 200-day moving average (also the 50-week moving average) is acting as a support at 1980 (see daily chart).
- The intermediate-term Stochastic has reached its ‘extreme’ overbought level (see daily chart).
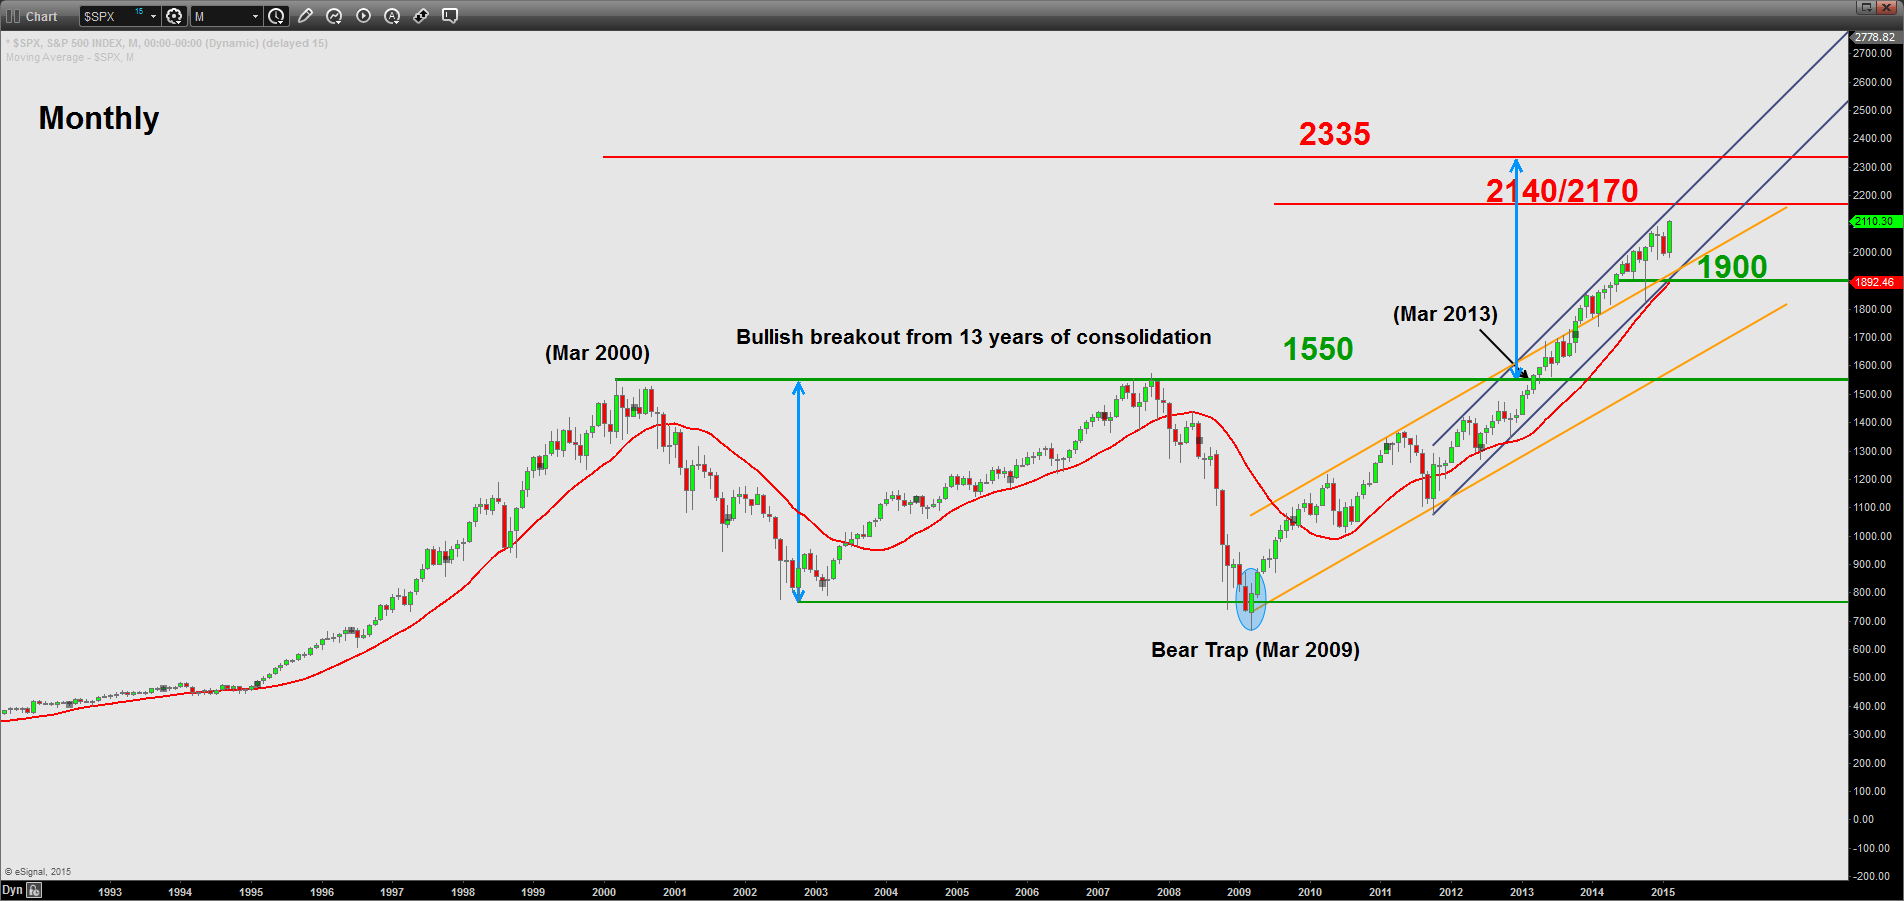
- The 2335 level is the potential bullish exit target of the former 13 years of range configuration in place since Mar 2000 high (see monthly chart).
Key levels (one to three months)
Pivot (key resistance): 2140/2170
Support: 1980/1975 & 1920/1900
Next resistance: 2240 & 2335
Conclusion
The multi-month uptrend for the S&P 500 is coming close to a key resistance at 2140/2170 and current technical elements are advocating for a potential decline towards 1980/1975 with a maximum limit set at 1920/1900 within a long-term bullish trend in place since March 2009.
However, a clear break above 2170 may invalidate the bearish scenario to see a further upside movement towards 2240 before 2335.


