


Micron Technology (MU)
click to enlarge charts
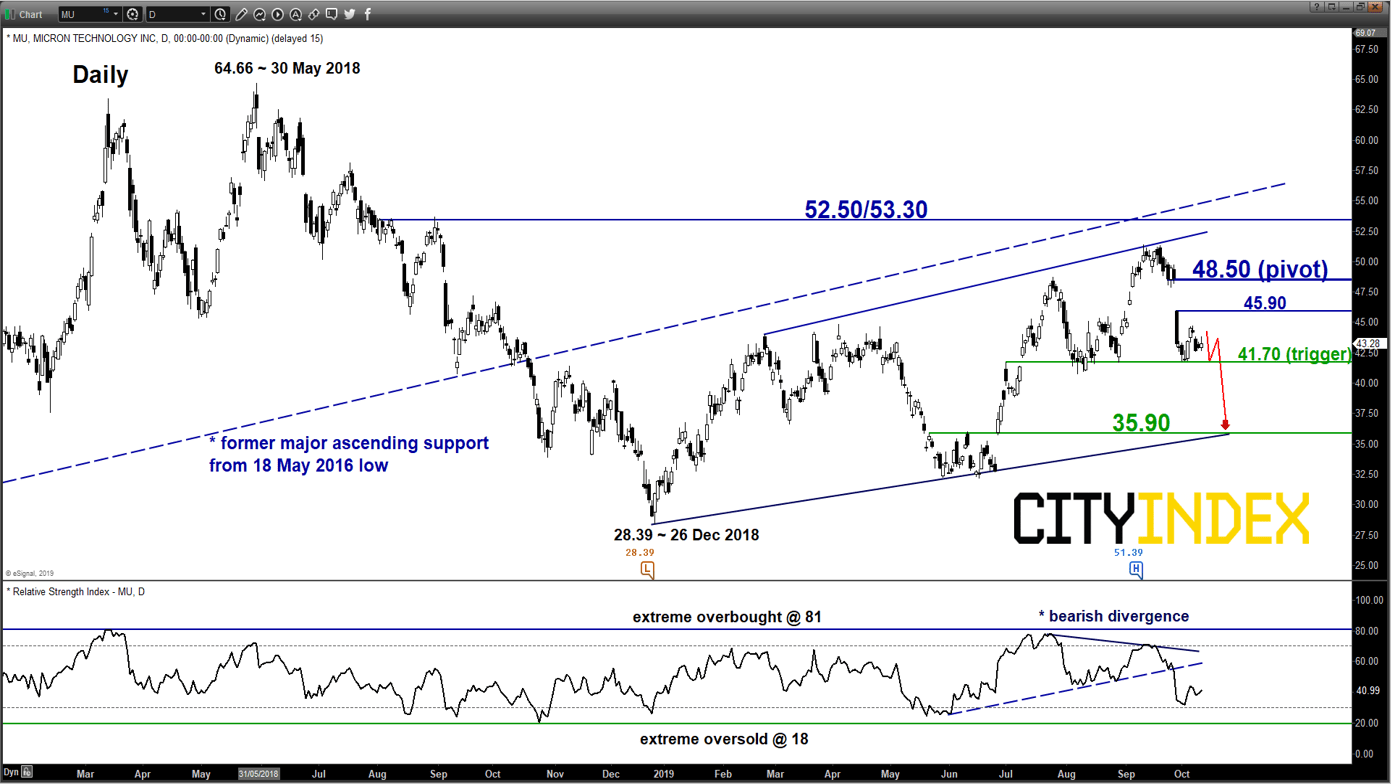
Key Levels (1 to 3 weeks)
Intermediate resistance: 45.90
Pivot (key resistance): 48.50
Supports: 41.70 (trigger) & 35.90
Next resistance: 52.50/53.30
Directional Bias (1 to 3 weeks)
Key medium-term pivotal resistance will be at 48.50 and a break below 41.70 reinforces a further potential push down within a medium-term ascending range in place since 26 Dec 2018 low to target the next significant medium-term support at 35.90.
On the other hand, a daily close above 48.50 invalidates the bearish scenario for a squeeze up towards the 52.50/53.30 zone (the upper boundary of the medium-term ascending range & the former major ascending support from 18 May 2016 low).
Key elements
- The 48.50 key medium-term resistance is defined by the upper limit of the gapped down formed on 27 Sep 2019 & the 61.8% Fibonacci retracement on the on-going slide from 11 Sep high to 02 Oct 2019 low.
- The next 35.90 significant medium-term support is defined by the lower boundary of the ascending range configuration from 26 Dec 2018 low and 76.4% Fibonacci retracement of the prior push up from 17 Jun low to 11 Sep 2019 high.
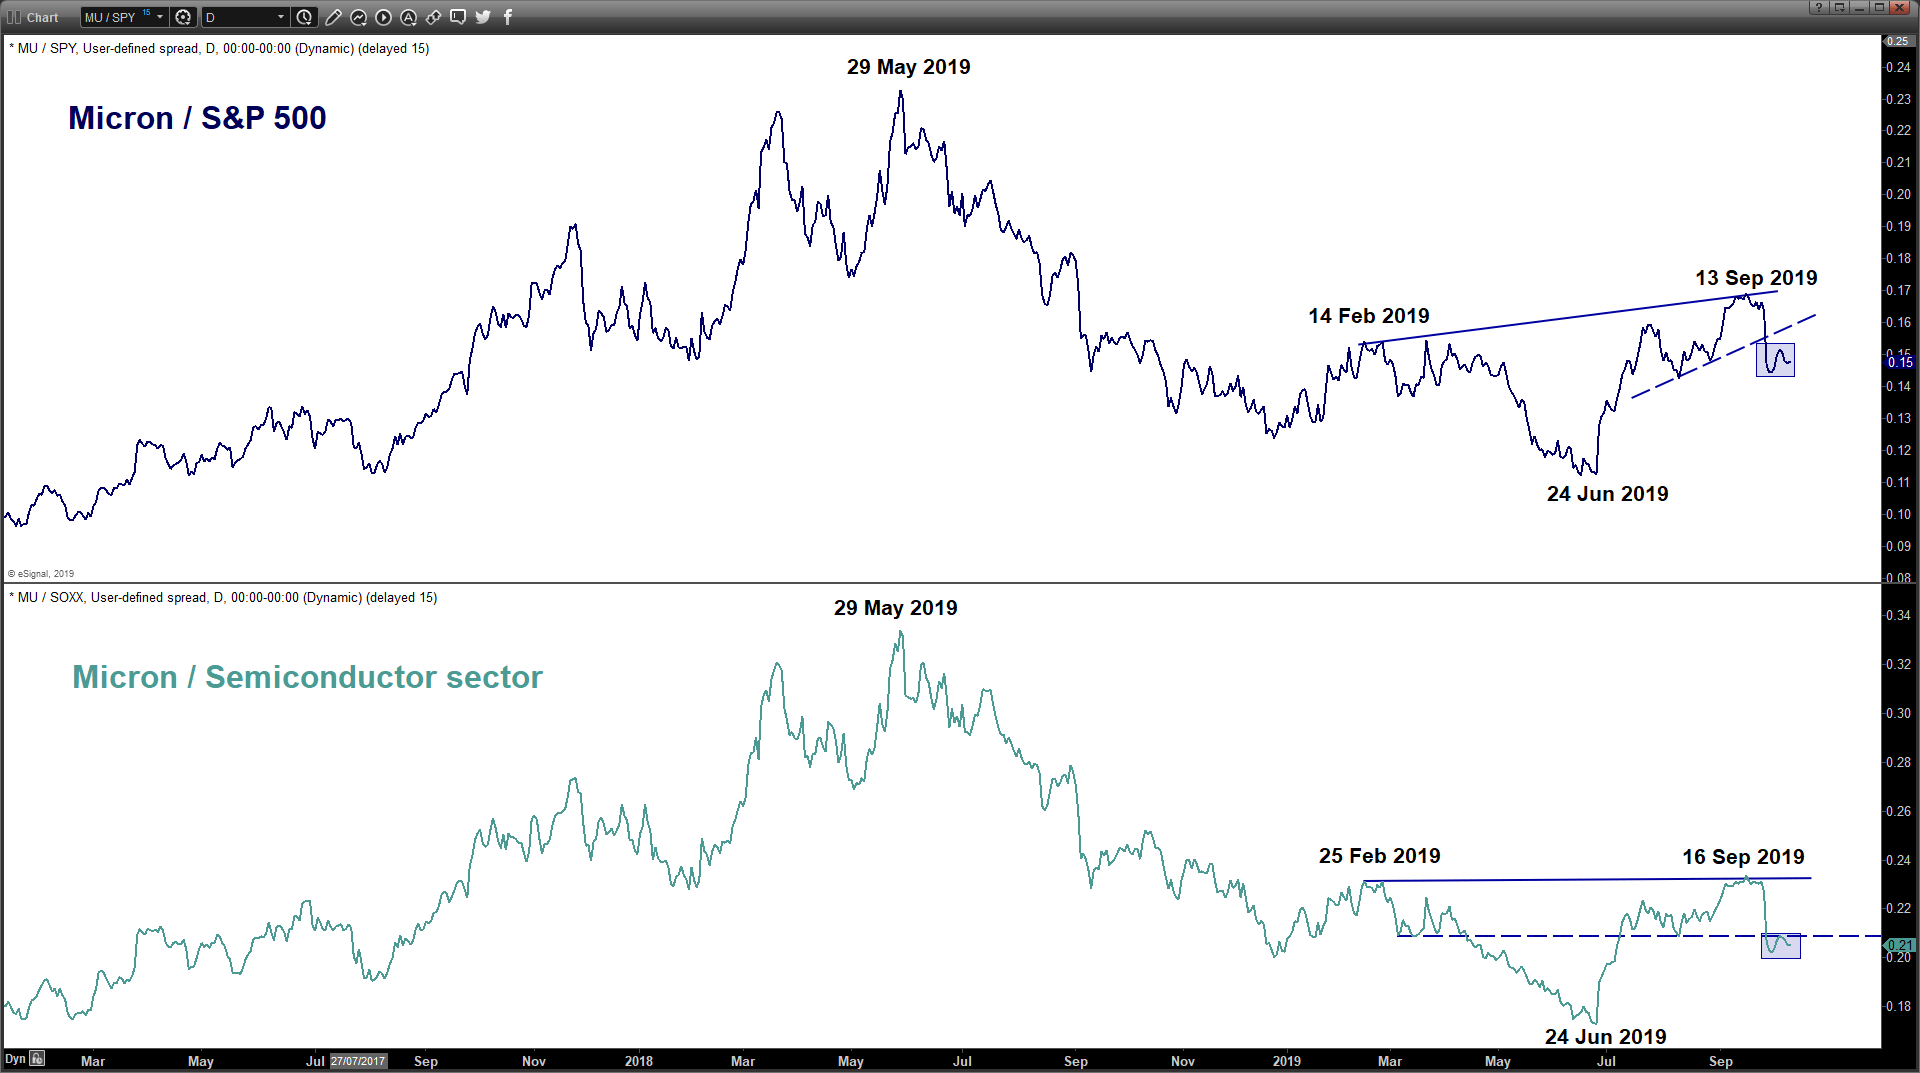
- Relative strength analysis from the ratio charts of MU against the market (S&P 500) and sector grouping (Semiconductor) suggests underperformance of MU.
Qualcomm Inc (QCOM)
click to enlarge charts
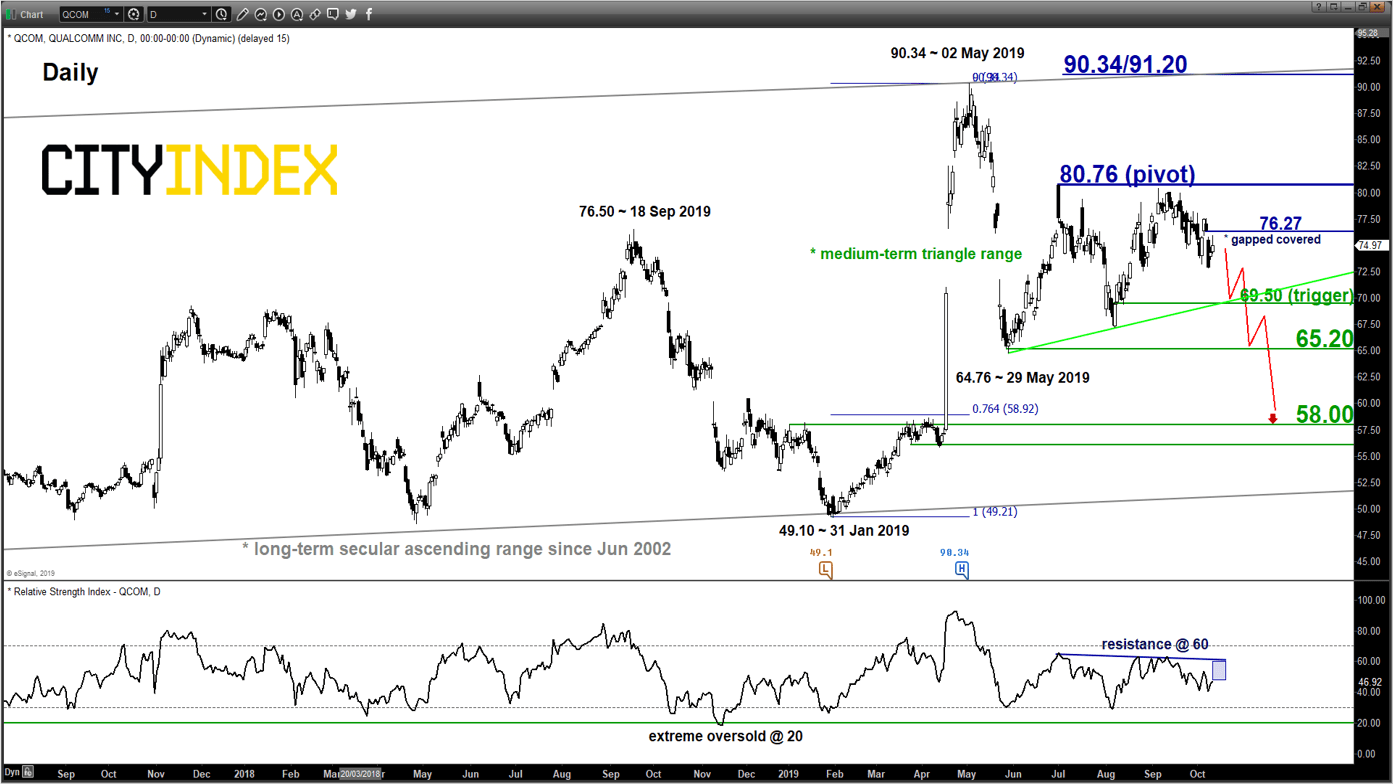
Key Levels (1 to 3 weeks)
Intermediate resistance: 76.27
Pivot (key resistance): 80.76
Supports: 69.50 (trigger), 65.20 & 58.00
Next resistance: 90.34/91.20
Directional Bias (1 to 3 weeks)
Key medium-term pivotal resistance will be at 80.76 and a break below 69.50 reinforces a potential push down towards the lower limit of the long-term secular ascending range configuration in place since Jun 2002 towards the significant medium-term supports of 65.20 and 58.00.
On the other hand, a daily close above 80.76 sees a squeeze up to retest 02 May 2019 swing high area of 90.34/91.20 (also the upper limit of the long-term secular ascending range configuration).
Key elements
- Yesterday’s rally of 0.83% seen in QCOM has managed to fill partially the intermediate gapped down resistance of 80.76.
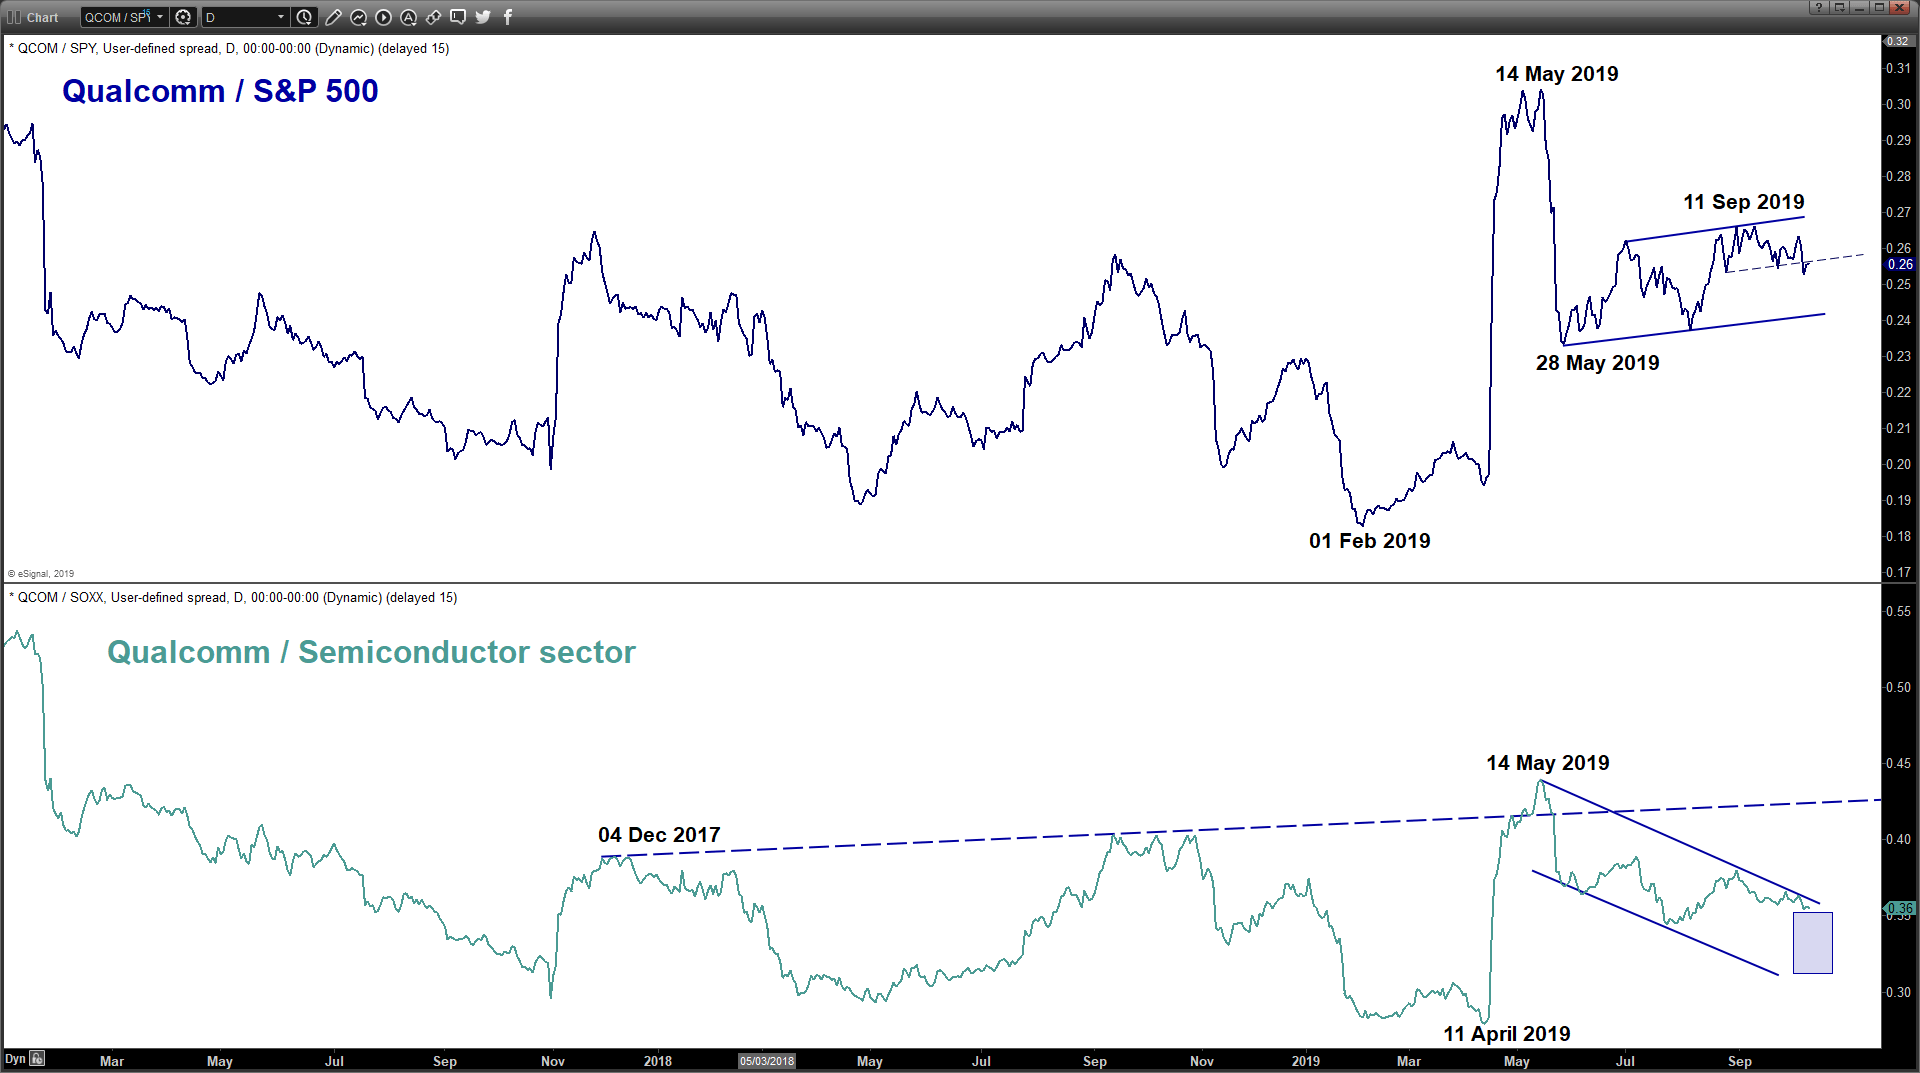
- Relative strength analysis from the ratio chart of QCOM against its sector grouping (Semiconductor) suggests QCOM still underperforming against the Semiconductor sector,
- The 58.00 key medium-term support is defined by the 76.4% Fibonacci retracement of the previous 5-month up move from 31 Jan low to 02 May 2019 high and the congestion area from 02 Jan/08 Apr 2019.
Charts are from eSignal
Latest market news
Yesterday 01:23 PM
Yesterday 06:01 AM
April 18, 2024 11:27 PM
Latest Tech Stocks articles
October 19, 2023 09:47 AM
October 18, 2023 12:06 PM
October 11, 2023 02:41 PM
October 3, 2023 12:24 PM