


Keppel Corp (SGX: BN4)
click to enlarge charts
Key Levels (1 to 3 weeks)
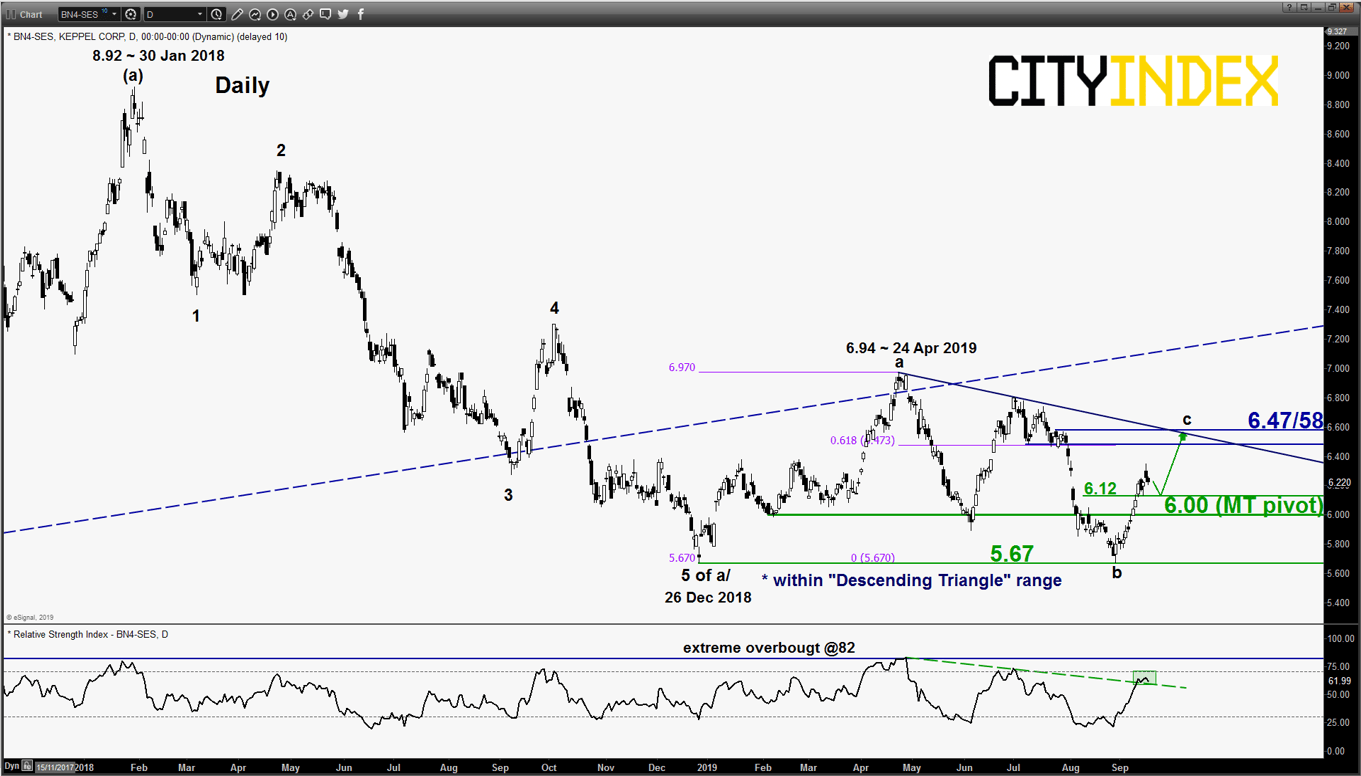
Intermediate support: 6.12
Pivot (key support): 6.00
Resistance: 6.47/58
Next support: 5.67
Directional Bias (1 to 3 weeks)
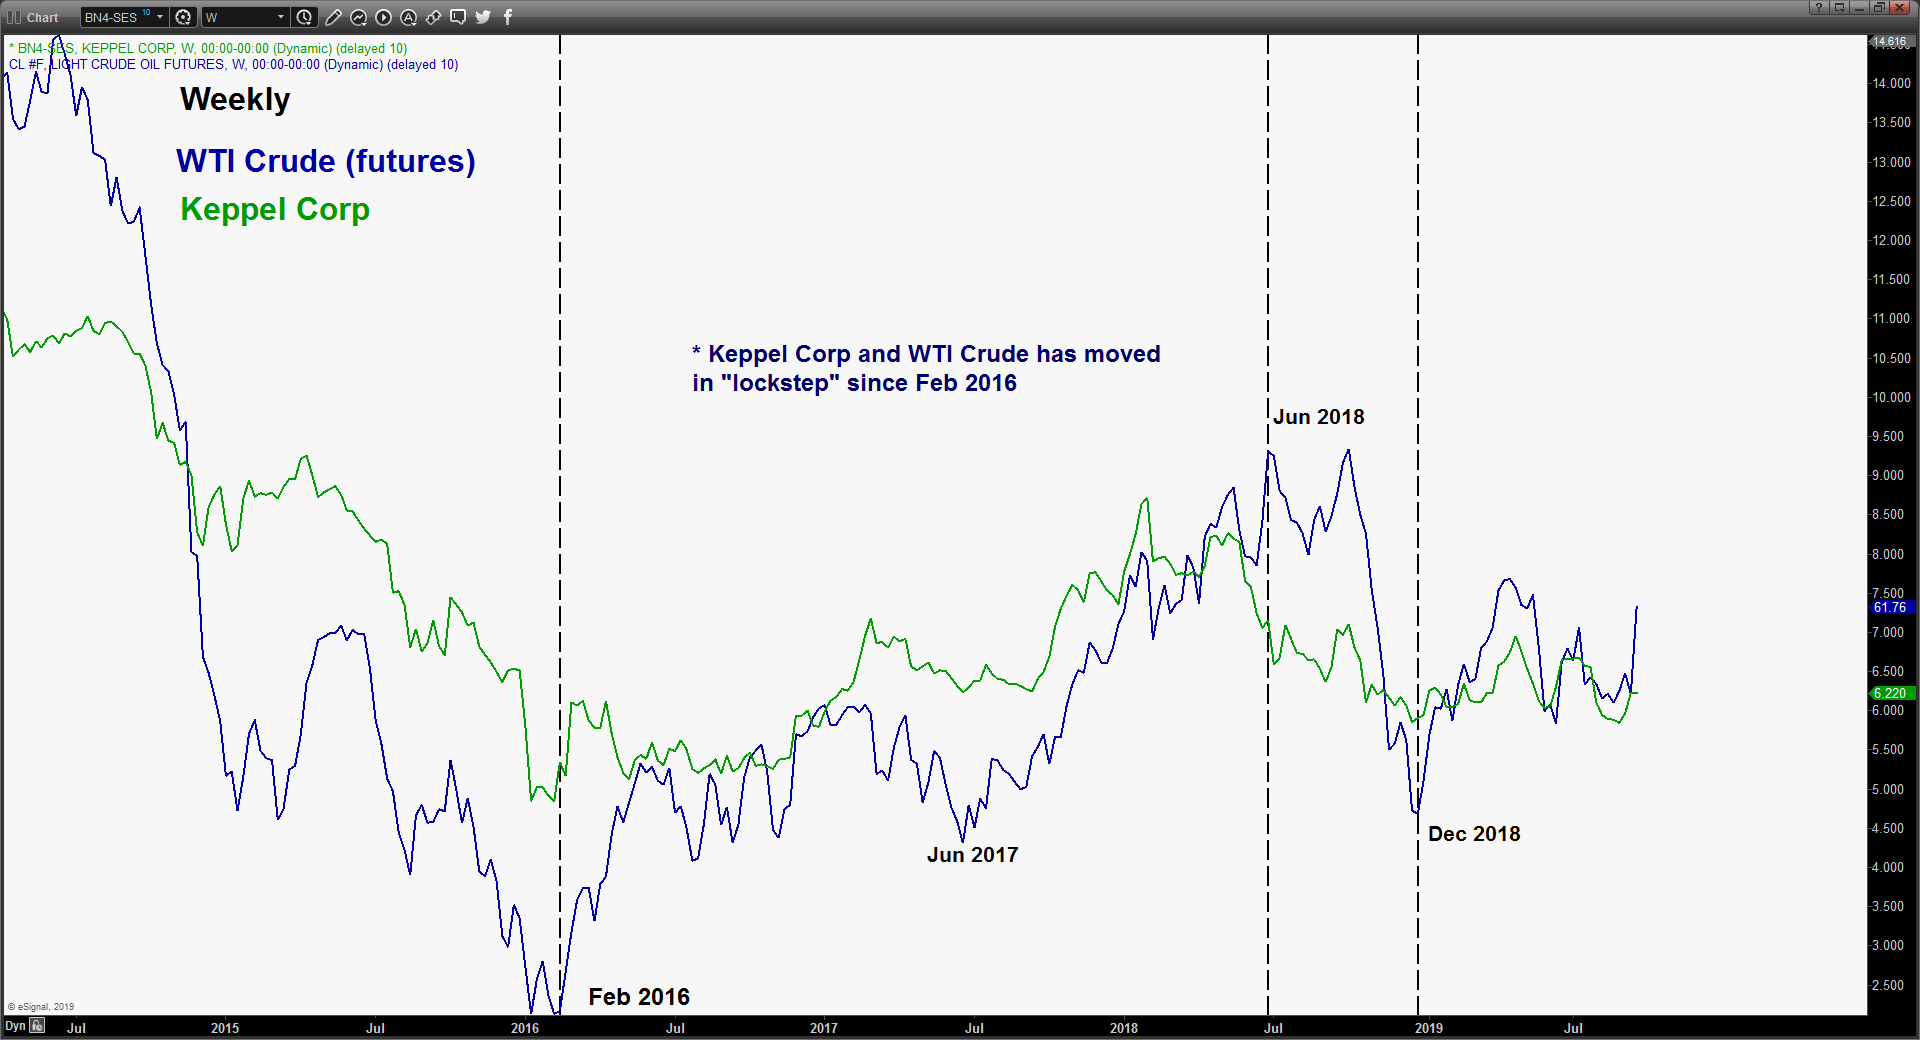
Bullish bias for Keppel Corp, a Singapore based conglomerate that has a significant business in the offshore and marine industry that tends to be impacted by the movement of oil prices. Also, Keppel Corp is also an index component stock of the FTSE Straits Times Index, the benchmark index for the Singapore stock market.
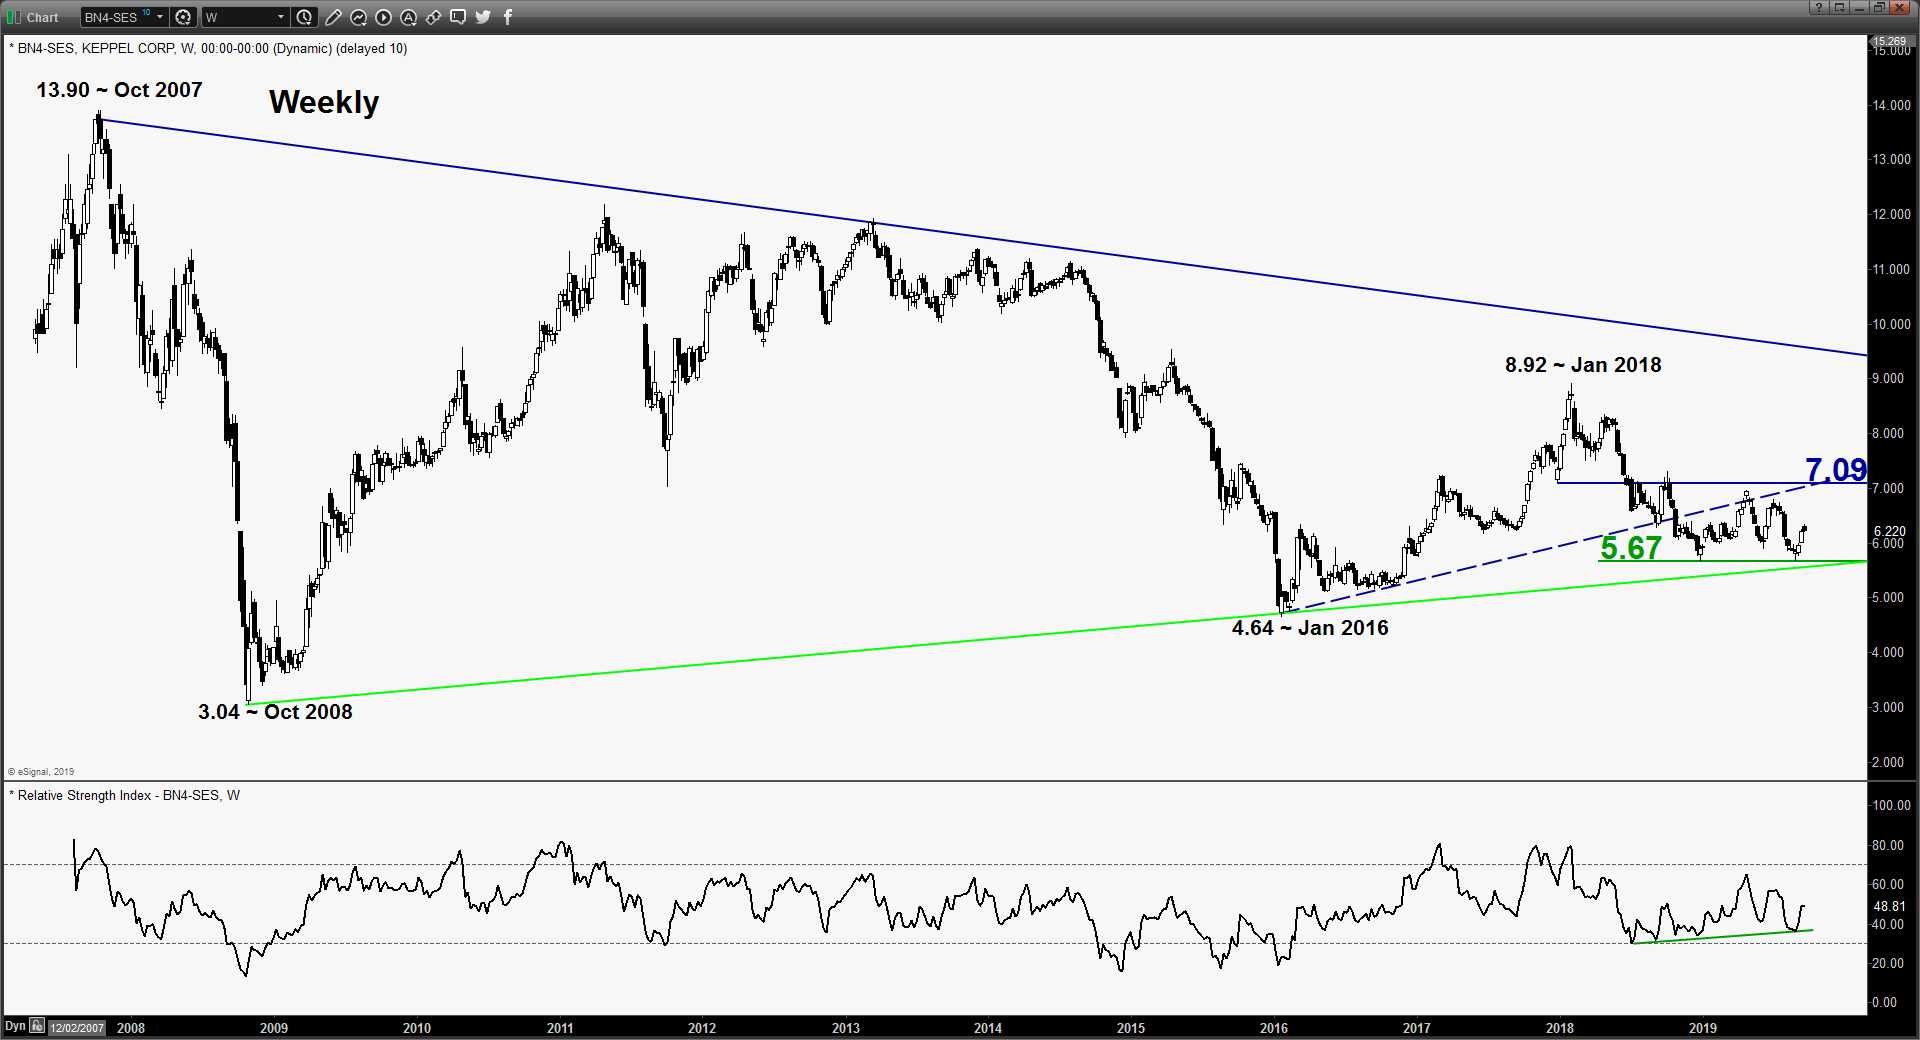
Key medium-term pivotal support will be at 6.00 for a potential push up to target the medium-term range resistance of 6.47/58 (upper limit of the “Descending Triangle). However, a break with a daily close below 6.00 negates the medium-term bullish tone for a slide back to retest the major range support of 5.67.
Key elements
- Since Feb 2016, the share price movement of Keppel Corp has been moving in lock-step; a direct/positive correlation with the price movement of WTI Crude. Since end of Dec 2018, WTI Crude has started to stabilise and Keppel Corp has managed to recover some “lost grounds” from a 12-month downtrend since Jan 2018.
- WTI Crude has continued to remain firm above 50.75 key medium-term support reinforced by a temporary “supply shock” from a disruption on Saudi Arabia oil pipelines due to last weekend drone attacks on the pipelines by Iranian forces as claimed by U.S. and Saudi Arabia.
- Since its 26 Dec 2018 low, Keppel Corp has evolved into a major “Descending Triangle” range configuration with positive medium-term momentum as indicated by the daily RSI oscillator.
- Elliot Wave/fractal analysis suggests the current push up from 29 Aug 2019 low of 5.67 is likely the intermediate degree wave c “push up” move of a typical 5-wave structure (a, b, c, d & e) of a triangle range configuration.
- The significant resistance zone of 6.47/58 is defined by the upper limit of the “Descending Triangle”, former swing lows of 09/22 Jul 2019 and 0.618 Fibonacci expansion of the previous push up from 26 Dec 2018 low to 24 Apr 2019 high projected from 29 Aug 2019 low.
Charts are from eSignal
Latest market news
Yesterday 08:33 AM
Latest Crude Oil articles
April 17, 2024 05:00 PM
April 17, 2024 03:02 AM
April 10, 2024 06:07 AM