Ken Odeluga BP leads sunken oil John Wood bests cornered oil services Poundland vs B amp M
BP – a long-term pick I believe all the oil sector dynamics outlined in the previous article will tend to reduce investor interest in the […]
BP – a long-term pick I believe all the oil sector dynamics outlined in the previous article will tend to reduce investor interest in the […]
I believe all the oil sector dynamics outlined in the previous article will tend to reduce investor interest in the biggest UK-listed oil firms in 2015, meaning diminished incentive for buying the biggest components of the FTSE 350 Oil & Gas Producers Index, BP, and Royal Dutch Shell.
I tend to think this will apply to even the worst-performing FTSE 100 stock of 2014, Tullow Oil Plc.
Whilst it always makes sense to expect at least some natural ‘elasticity’ in the performance of virtually any FTSE 100 stock, my view is that the risks remain on the downside for Tullow, with better value to be had elsewhere in the sector.
Looking beyond the first six to eight months of 2015, I might be less pessimistic about oil.
Bearing in mind even the least esoteric of the various production cycles that tend to prevail in crude oil production, which tend to be self-perpetuating, the oil price falls that led to the collapse of oil price assets will abate in time.
Consider the simplified chart below.
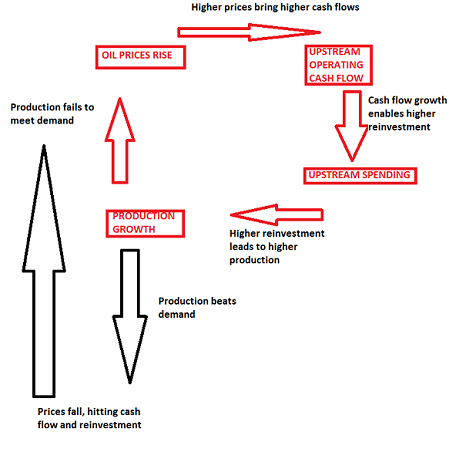
On a cyclical basis, established oil majors remain investible, and perhaps more so in a downturn when values are diminished, because of their recovery potential.
The main issue with this perspective, of course, is that the time frame is likely to require patience.
My grossly over-simplified diagram above leaves out a lot, including OPEC’s apparent unwillingness (whatever its motivation) to push for production cuts that tend to buoy prices, as seen at the cartel’s meeting late in November.
But the above basic cycle is likelier than not to prevail in an obvious way.
For the longer-term holder, this affords the opportunity to select the ‘strongest’ players. These also ought to be the structurally soundest with the best dividends.
I choose BP Plc. for what looks to me to be its more progressed reorientation to the new cost environment.
The Gulf of Mexico disaster may have in effect put BP ahead of the industry’s cost-cutting curve. The company was forced to sell oil and gas fields in the United States, the North Sea and elsewhere, reducing production to just over two million barrels a day from about three million barrels a day before the blowout.
This is not counting output from BP’s near-20% holding in Russia’s state-controlled Rosneft (which is a key-Ukraine-linked risk, despite the reportedly relative cheap costs of operating in Russia).
More detail in the table below.
Of all the FTSE 100-listed oil majors, there will be no better dividend payer, according to consensus of institutional analysts compiled by Thomson Reuters.
On the negative side, the table also tells us that BP’s higher than average beta puts it at greater risk of deeper falls than the market average, even if it may also imply greater upside risk in a rising market.
On balance, of the majors, I prefer BP as the best risk versus the closest alternative, Shell, as payment and recovery play.
On 11th December BP said it would cut jobs and take $1bn in restructuring charges over the next five quarters.
The company said it did not yet know how many people would be let go, but that most of the money would go to severance packages. BP had around 84,000 employees at the end of 2013.
Additionally, in March 2014, before oil prices tanked, BP said spending would be between $24bn and $26bn a year through 2018.
That estimate must be cut by up to $2bn or more in 2015.
| Company Name | Fwd P/E (FY1) | Price/Sales Ratio (FY1) | Relative Valuation EV/EBITDA, NTM | P/free cash fl. (FY1) | P/book per share (FY1) | Relative Valuation Dividend Yld., NTM | Relative Valuation EV/Sales, NTM | Dividend Yld., Last FY | Beta 5 Yrs |
|---|---|---|---|---|---|---|---|---|---|
| BG Group PLC | 12.16 | 2.7% | 6.82 | 1.26 | 2.6% | 3.17 | 2.3% | 1.14 | |
| BP PLC | 9.36 | 0.3% | 4.41 | 19.93 | 0.86 | 6.8% | 0.47 | 6.1% | 1.71 |
| vs. group average | -22.5% | -85.0% | -16.8% | -49.4% | -27.6% | 31.0% | -58.2% | 23.1% | 83.6% |
| Chevron Corp. | 11.20 | 8.2% | 6.25 | 1.31 | 4.0% | 1.50 | 3.6% | 1.13 | |
| Eni SpA | 12.49 | 0.5% | 3.66 | 24.77 | 0.80 | 7.9% | 0.72 | 8.1% | 0.73 |
| Galp Energia SGPS SA | 22.12 | 6.83 | 1.20 | 4.5% | 0.51 | 3.6% | 0.89 | ||
| Royal Dutch Shell PLC | 8.77 | 0.3% | 4.62 | 14.67 | 1.13 | 5.9% | 0.67 | 5.7% | 0.99 |
| Repsol SA | 11.49 | 5.18 | 44.90 | 0.74 | 6.7% | 0.54 | 6.7% | 0.91 | |
| Statoil ASA | 9.62 | 0.7% | 2.86 | 72.26 | 1.10 | 5.6% | 0.93 | 5.5% | 0.79 |
| Total SA | 8.90 | 0.7% | 4.38 | 53.48 | 1.07 | 6.3% | 0.79 | 6.5% | 0.91 |
| Exxon Mobil Corp | 11.95 | 0.9% | 7.03 | 26.10 | 2.10 | 3.1% | 1.18 | 2.7% | 0.88 |
Data from Thomson Reuters
Abbreviations:
Fwd: P/E forward price/earnings ratio
FY1: first fiscal year from estimate
EV: enterprise value
EBITDA: earnings before interest, taxation, depreciation and amortisation
NTM: next twelve months
P: stock price
Yld: yield
It’s difficult to favour the current levels of the stock for entry.
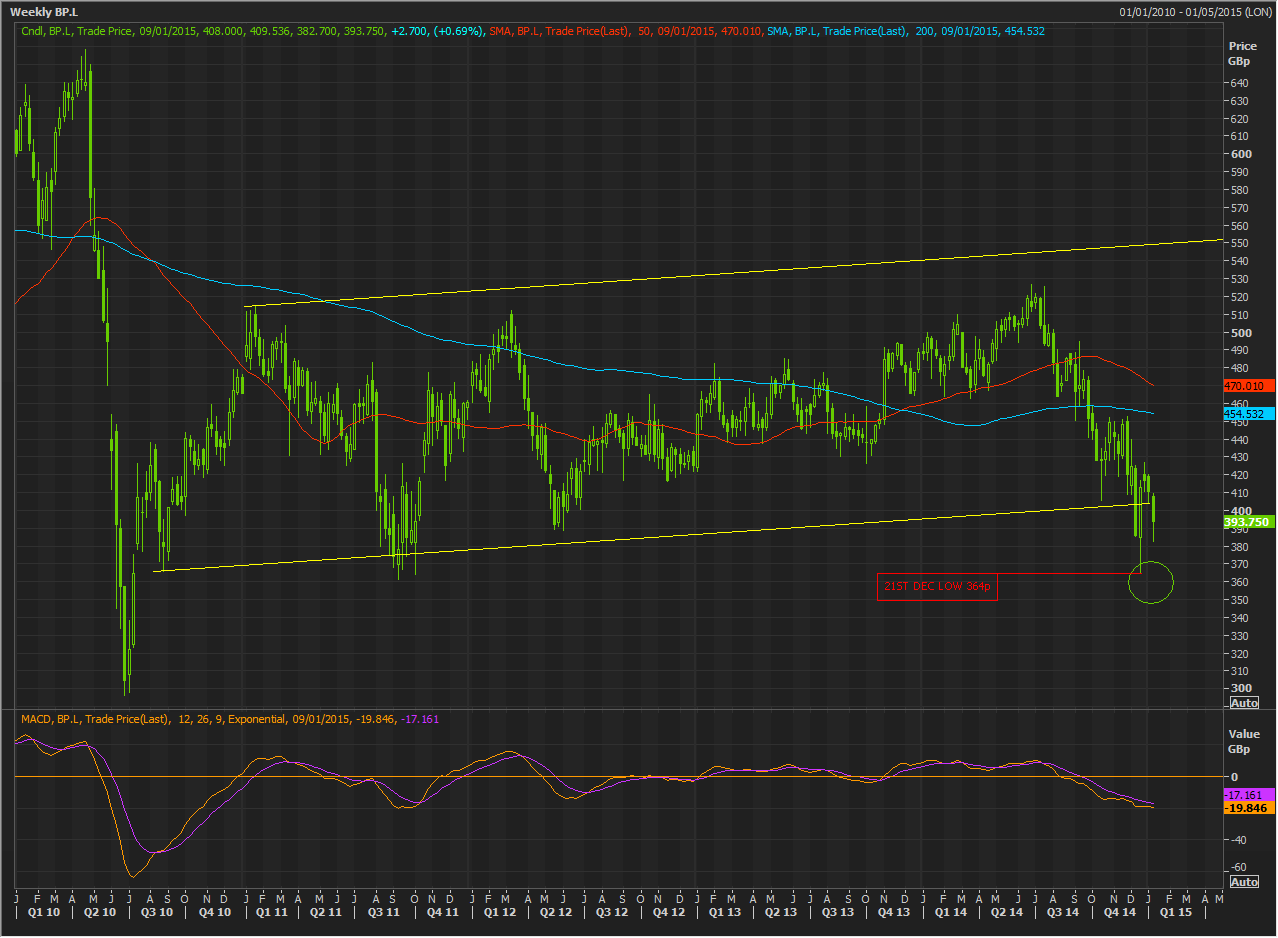
I would like to see the share price re-enter a broad channel visible in the weekly chart that has quite simple to identify limits on the up and downside, though there is a chance a similar bounce from December lows around 364p could be seen, if the price reproaches that region.
Either way, momentum (here measured by the Moving Average Convergence Divergence system) would also need to provide good chances of rising momentum.
Looking further downstream, reasoning necessarily has to become more abstruse and perhaps arbitrary.
Whilst it makes sense to expect the rest of the crude oil sector to suffer along with the majors, I don’t think we can dismiss all its constituents out of hand.
With the E&P firms, the bigger, more deeply entrenched and relatively leaner have a natural advantage.
Digging even deeper, there are structural cost factors affecting many of the services firms that will provide more advantages for some than others.
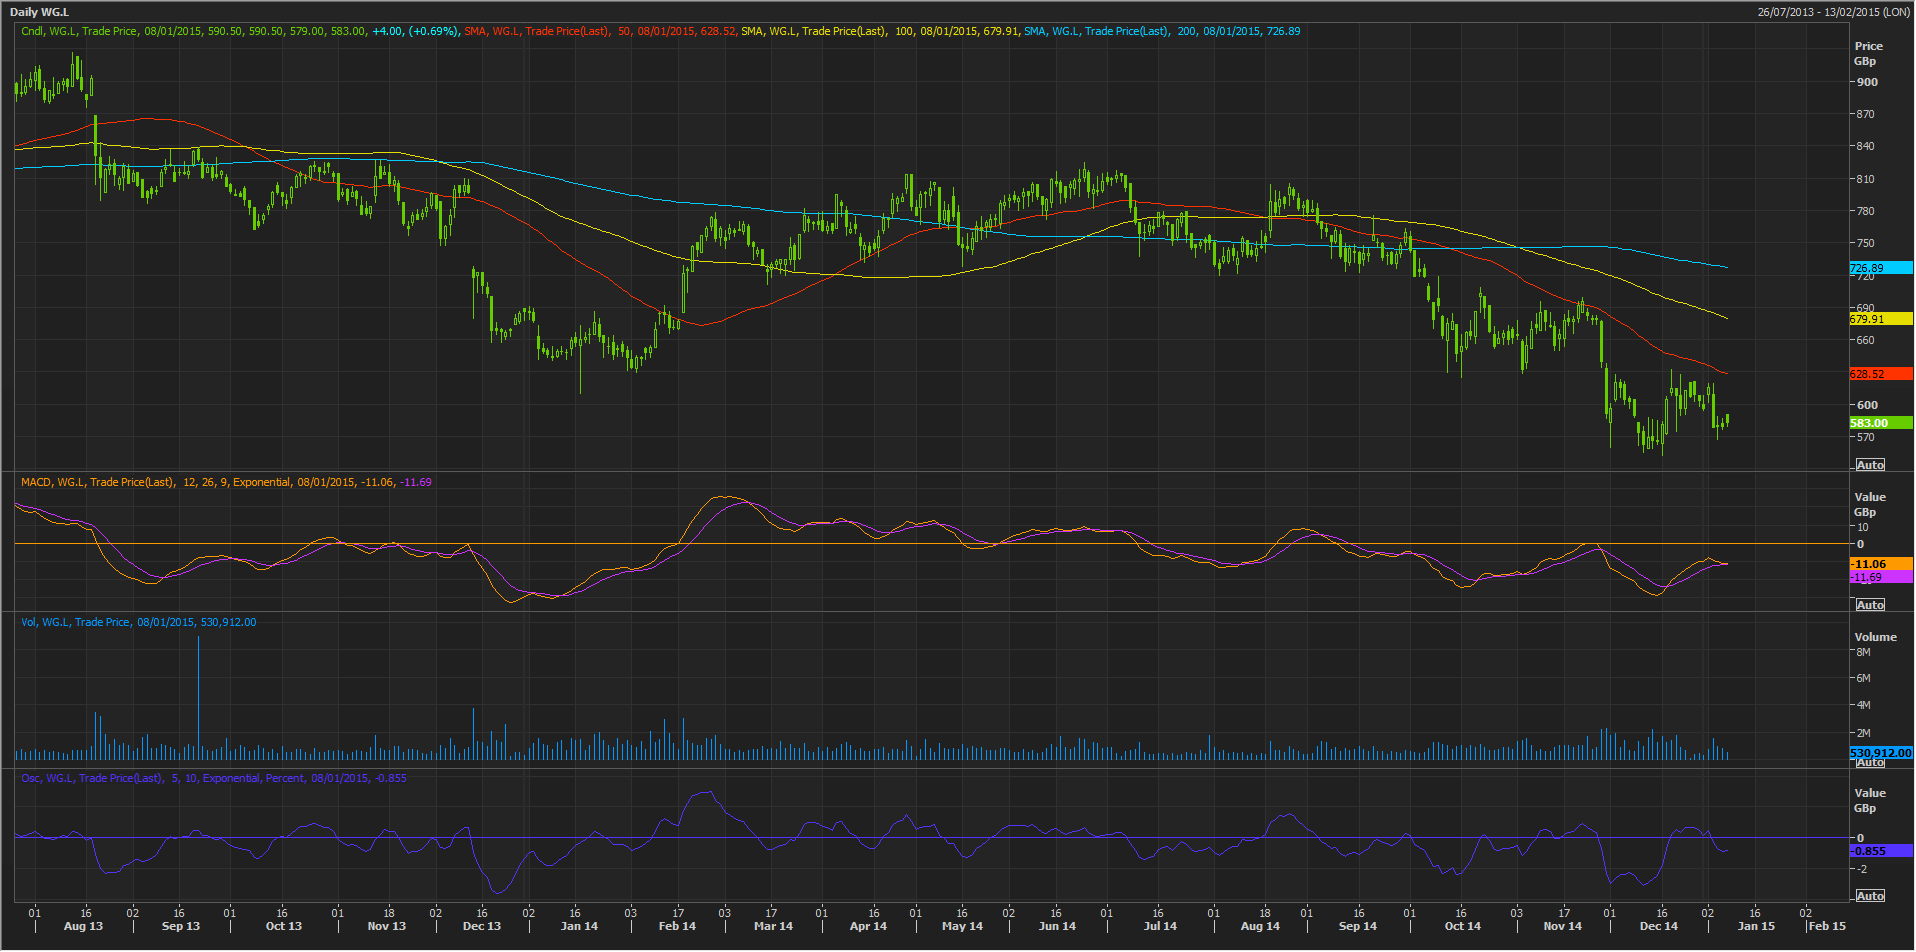
Enter John Wood Group Plc. which provides engineering, production support and turbine services to the oil and gas, and power sectors.
It’s of modest size compared to its larger peers in the FTSE 350 Oil Equipment, Services & Distribution sector – like Amec Foster Wheeler Plc. – but it appears to have an edge due to a contract structure that is common in this segment that enables its contract order book to be largely reimbursable amid a range of long-term contracts.
In a trading update in December, Wood said it expected its business to be resilient relative to its sector in 2015 helped by reimbursable orders.
Wood said it anticipated full-year 2014 performance to be higher than last year’s and in line with expectations.
In essence, the firm stated that despite the steep fall in oil prices that’s leading operators to re-consider spending plans for 2015, the reimbursable element of already signed contracts will help Wood Group receive full payment for any cost overruns.
Wood also said it had secured a $750m five-year contract from BP for engineering, procurement and construction services in Grangemouth, Scotland.
Having earlier won a subsea contract from BP for the Shah Deniz II gas project in Azerbaijan in June, Wood said the latest contract was its largest in 2014 and included an option for two, one-year extensions.
It also purchased Swaggart Brothers, an Oregon-based provider of civil construction and fabrication services for $36.3m with a further payment in 2017 based on future performance.
Wood upgraded guidance on earnings before interest, taxation and amortisation (EBITA).
It now expects its Engineering division (its second largest) to beat guidance provided in December 2013, when it warned EBITA would fall by around 15% in 2014.
The firm is expected to have generated group revenues of $7.495bn when it reports final 2014 results on 17th February, according to consensus forecasts compiled by Thomson Reuters. That’s a 6% rise from the year before.
Net income could rise by as much as 25% in the current year and even extend a further 4% in 2015: performances that would be well ahead of the sector average.
Bear in mind Wood Group trails the group of close peers badly on dividend yield, (-51% on a forward basis).
But the stated pay-out ratio of 28% is curious against that yield. In relative terms, as oil sector dividends are cut, Wood Group looks to be on firm ground.
The modest premium to the sector, 1.7%, on price-to-earnings also interests me on the basis the market will need to decide on a leader in UK oil services, and John Wood could be undervalued.
The Food & Drug Retailers sector was another clear loser, particularly the grocery segment which surely contributed the bulk of the group’s near-40% value destruction.
The troubles faced by Britain’s established grocers took up more column inches than perhaps any other business news theme in 2014.
And the last major set of grocery sector data for the year provided only measly respite.
Retail market research firm, Kantar Worldpanel, said in its latest report, covering the 12 weeks to 7th December, Britain’s grocery market eked out growth of 0.1% year-on-year.
The slim uptick followed the first-ever decline in the UK grocery market, since Kantar had been monitoring it, in the prior 12-week period.
Sales at Britain’s so-called “big four” fell further, while discounters Aldi and Lidl reached a record combined market share of 8.6%.
Tesco (still the market leader although its lead is rapidly diminishing) saw its sales fall 2.7% more.
However, that was its best result since June, offering a glimmer of hope that its sales just might be stabilising.
Sales at Wal-Mart-owned Asda, Sainsbury’s and Morrisons fell 1%, 1.8% and 3.2% respectively.
Aldi’s sales were up 22.3%, while Lidl’s were up 18.3%.
This week, many of the supermarkets released interim updates covering the important Christmas period.
A couple of the largest were able to almost suggest they were beginning to turn the tide.
Sainsbury’s reported a fall in sales from stores open longer than a year of 1.7%, excluding fuel, in the 14 weeks to 3rd January: its third quarter. Analysts were expecting a fall of at least 2.5%.
Later in the week, Tesco said same-store sales, excluding petrol, fell 2.9% in the 19 weeks to 3rd January. This was better than most analysts’ predictions and a significant improvement on a decline of 5.4% in the second quarter. It also announced sweeping changes including the closure of 43 stores, a £1.35bn capex scale back and it cancelled the final dividend for the year.
Tesco aims to make savings of £250m a year from restructuring of central overheads, simplification of store management structures and increased working hours.
Only Marks & Spencer produced like-for-like sales that disappointed, posting a 5.8% fall in the thirteen weeks ending 27th December, when the market expected -3%. M&S said it ran into unexpected glitches at its new distribution centre.
Still, none of the UK’s big established supermarkets went so far as to claim they were seeing sustainable gains in market share, revenue growth and like-for-like sales.
This is largely because none, not even Tesco, have made deep and radical enough cuts that would enable them to compete on price with the discounters.
Most continue to make only selectively substantial cuts, which are insufficient.
Interestingly, whilst Tesco’s shares jumped 15% after its Christmas update, setting the stock up for its biggest rise in one day rise since a 13% surge on 2nd December 2008, and Sainsbury’s stock rose as much as 5% intraday, M&S shares lost 3.5% on the day of its weak trading update.
Still, the significance of that should not be overestimated. Marks remains the only listed UK supermarket group to post like-for-like food growth for two quarters in a row last year, albeit it was anaemic, between 0.1%-0.2%.
Beyond that, M&S continues to show the benefits of its better calibration to the ‘upper bracket’ higher-margin food segment, also containing John Lewis Partnership (through Waitrose).
The segment is arguably on a better footing for growth than the broadest grocery retail side, and it’s one which the so-called ‘Big Four’ (Tesco, Sainsbury, Asda) have failed to plant any convincing flags on.
We ought to reason that investible growth lies in the direction of broad consumer choice, and that is on the discount side.
Investing in the UK low-cost segment is not straightforward.
There are few listed players, with Poundland Group Plc. the most prominent. I think Poundland makes a strong case as a play on the low-cost UK supermarket segment, with half-year earnings
in November jumping 11.7% to £9.3m for the 26 weeks to 28th September against the comparative period, and like-for-like sales up 4.7% on a constant-currency basis.
This needs to be balanced against its poor forward yield of 1.5% and the overall sense that it lacks the focus, canniness and aggression of the near-notorious Aldi and Lidl (which are unlisted.)
On that basis, it looks like there is a better opportunity than Poundland, in a relatively overlooked listed UK rival.
Market forecasts expect London-listed small cap B&M European Value Retail SA to grow marginally faster than Poundland: consensus forward PE of 27.65 vs. 25.87 for Poundland.
Shares of the latter have so far failed to build up steam from the highs on their IPO day: 401p, on 12th March 2014 and they’re currently 15% lower at 342p.
Poundland stock seems to be ‘on watch’ with investors in this segment, due to its stronger-than-average weighting to UK consumer strength, competition against established value-end non-food and food (Morrisons and ASDA), and of course Aldi and Lidl.
It’s most direct rival is N. Brown Group Plc., and whilst the market expects Poundland to grow faster than N. Brown, we suspect the investment case is edged by the much more sophisticated multi-channel discount operator B&M, chaired by former Tesco CEO Terry Leahy.
For the moment we need to take Poundland at its word, after it said in November its performance for the full-year was “dependent on delivering a good Christmas”. Its next earnings report has yet to be scheduled.
At the same time consensus forecasts place B&M net income for 2015 at £102.85m, against £33.5m for Poundland, possibly evidence of the former’s purchase of a majority stake in Germany’s JA Woll discount chain last year.
There’s evidence of contradiction here: although neither B&M nor Poundland currently yield a value comparable to the market average, the expected price-to-earnings gradient of B&M sharply lags its rival by 23%.
At the same time, B&M current enterprise value over sales would provide much for the group to grow into (and I think it’s very likely to) with a near 150% premium against Poundland’s.
The balance is that for this fledgling low-cost segment, which is very likely to be the retailing mainstream of the future, for now I opt for B&M Value.
| Company Name | Fwd P/E FY1 | EV/EBITDA, NTM | P/FCF FY1 | P/BPS FY1 | Div Yld, NTM | EV/Sales, NTM | Div Yld, LFY | Price Target – Mean Estimate | P/E/G (mean estimate) FY1 | EPS Estimate FY1 | Net Income – Mean Estimate FY1 |
|---|---|---|---|---|---|---|---|---|---|---|---|
| Poundland Group PLC | 25.87 | 12.71 | 30.67 | 4.16 | 1.5% | 0.69 | 0.0% | 3.38 | 0.69 | 0.13 | 33,545,140.00 |
| B&M European Value Retail SA | 27.65 | 16.02 | 3.99 | 1.4% | 1.70 | 0.0% | 3.12 | 0.53 | 0.10 | 102,789,500.00 | |
| Premium/discount | 6.9% | 26.1% | -4.1% | -2.4% | 147.6% | -7.9% | -22.9% | -22.1% | 206.4% |
Data from Thomson Reuters
Abbreviations:
Fwd: P/E forward price/earnings ratio
FY1: first fiscal year from estimate
EV: enterprise value
EBITDA: earnings before interest, taxation, depreciation and amortisation
NTM: next twelve months
P: stock price
Yld: yield
If you found this article useful, you might also want to read Ken’s article on the FTSE at risk of significant correction as global equities weaken.
