Kelvin Wong US stocks to watch in 2015
As 2014 drew to a close the US stock market, as measured by the bellwether S&P 500 index, was set to record another year-to-date double […]
As 2014 drew to a close the US stock market, as measured by the bellwether S&P 500 index, was set to record another year-to-date double […]
As 2014 drew to a close the US stock market, as measured by the bellwether S&P 500 index, was set to record another year-to-date double digit percentage gain, and a new historical high above the 2000-level. This has marked the fifth year of the major bullish trend in place since the famous “666”-low seen on 6 March 2009.
A breakdown of the nine major US sectors’ year-to-date returns (as of 19 December 2014) according to its respective SPDR Select Sector Exchange Traded Fund (ETF) is as follows:
Performance Statistics (excluding dividends) (2 January 2014 to 19 December 2014)
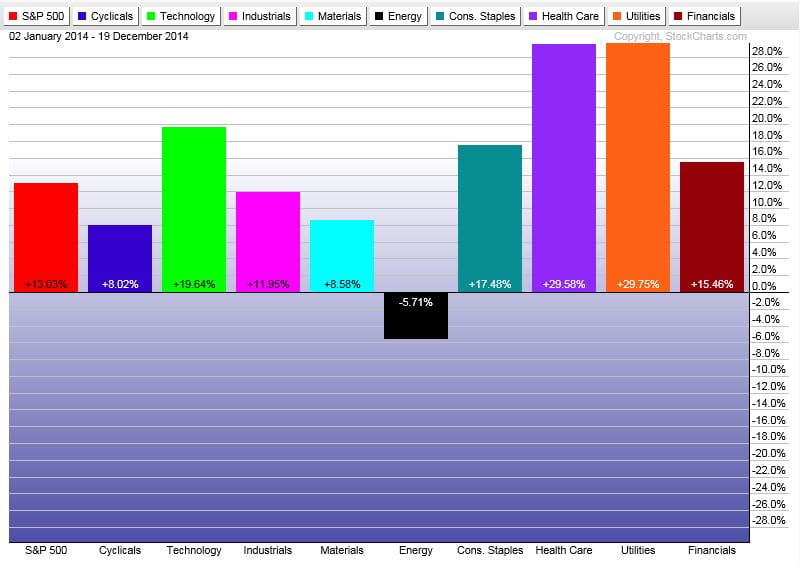
Source: www.stockcharts.com. Shown for illustrative purposes only. Past performance is no guarantee of future results.
The top three outperformers are Utilities (29.75%), Health Care (29.58%) and Technology (19.64%). In contrast, the energy sector is the worst performer , recording a negative return (-5.71%). The dismal performance seen in energy stocks is caused by a horrendous plunge of 49% in the price of crude oil that occurred in the second half of 2014.
Going forward, which sectors are likely to outperform the benchmark S&P 500 index in 2015? To answer this golden question, let’s use an objective approach to analysing their expected performance in 2015 by plotting the respective sector ETF against the S&P 500 ETF. This approach of technical analysis is called “Relative Strength” charting.
“Relative Strength” charting will enable us to have a gauge whether the respective sectors are outperforming, underperforming or neutral against the S&P 500.
The top three expected outperformers in 2015 are as follows, based on their respective “Relative Strength” charts:
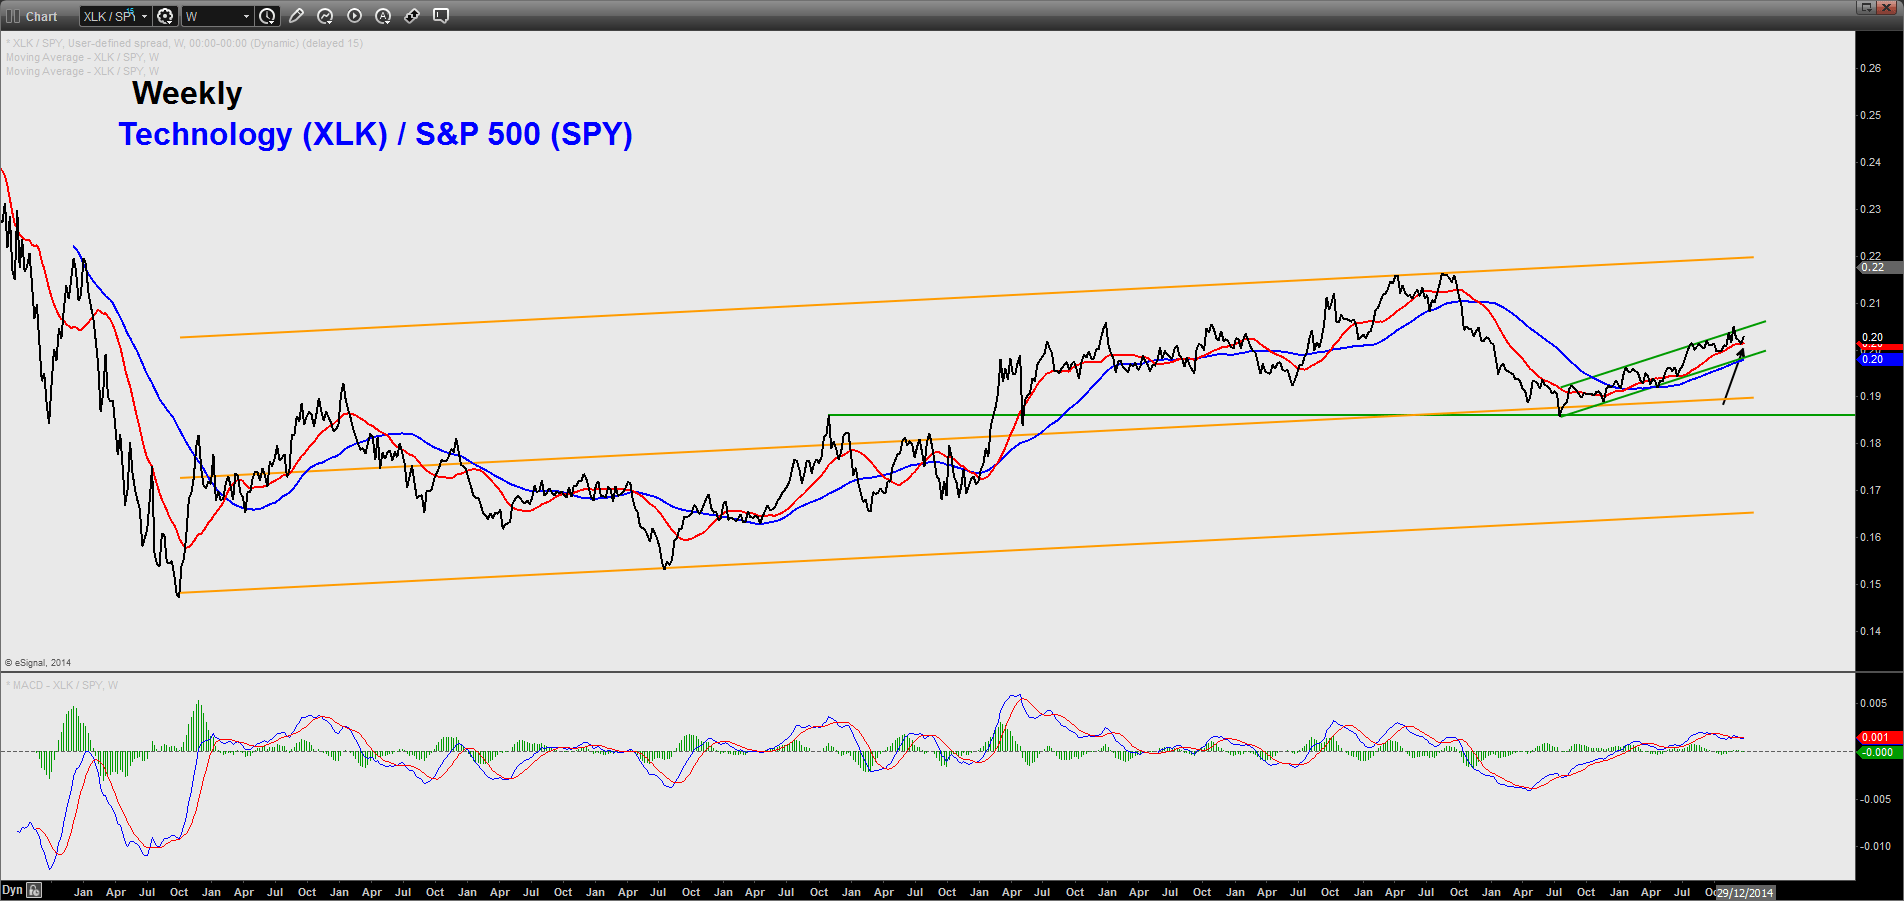
The Technology / S&P 500 ratio has continued to exhibit positive traits as it remains above its 20 and 50-week Moving Averages and still has ample “room” towards the upper boundary of its long-term ascending channel.
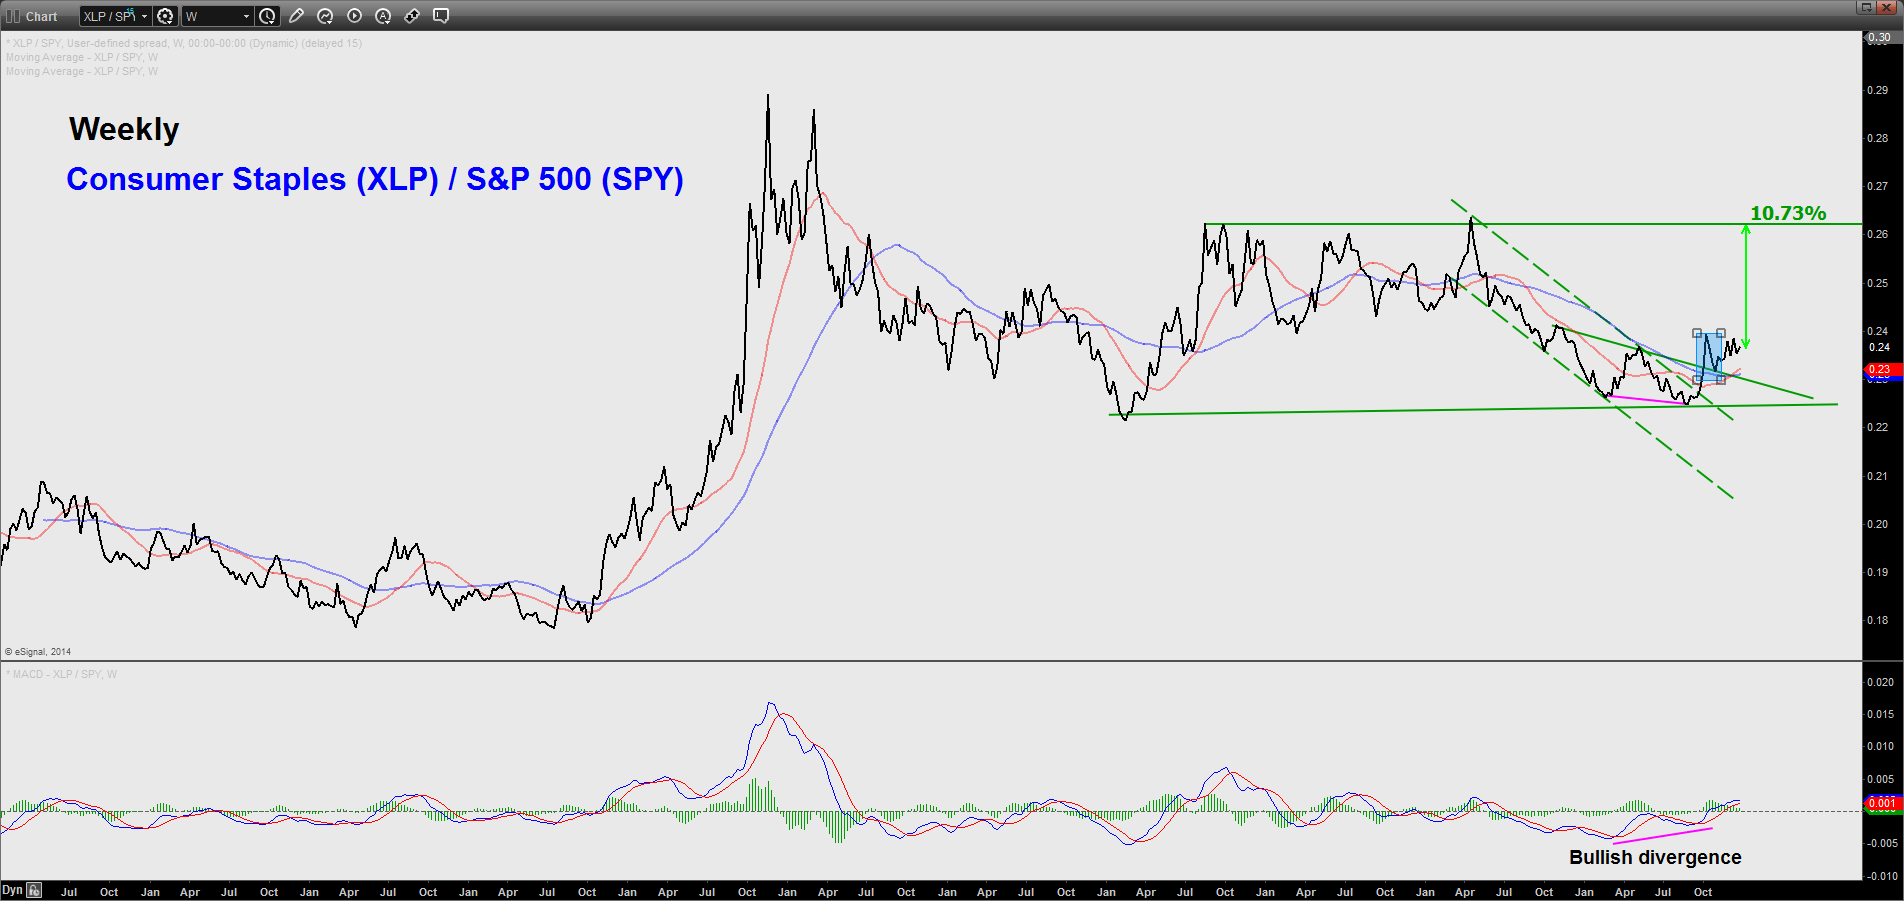
The Consumer Staples / S&P 500 ratio remains bullish since the breakout of its former trendline resistance and 20/50-week Moving Averages. Current elements advocate further upside potential towards its long-term range top.
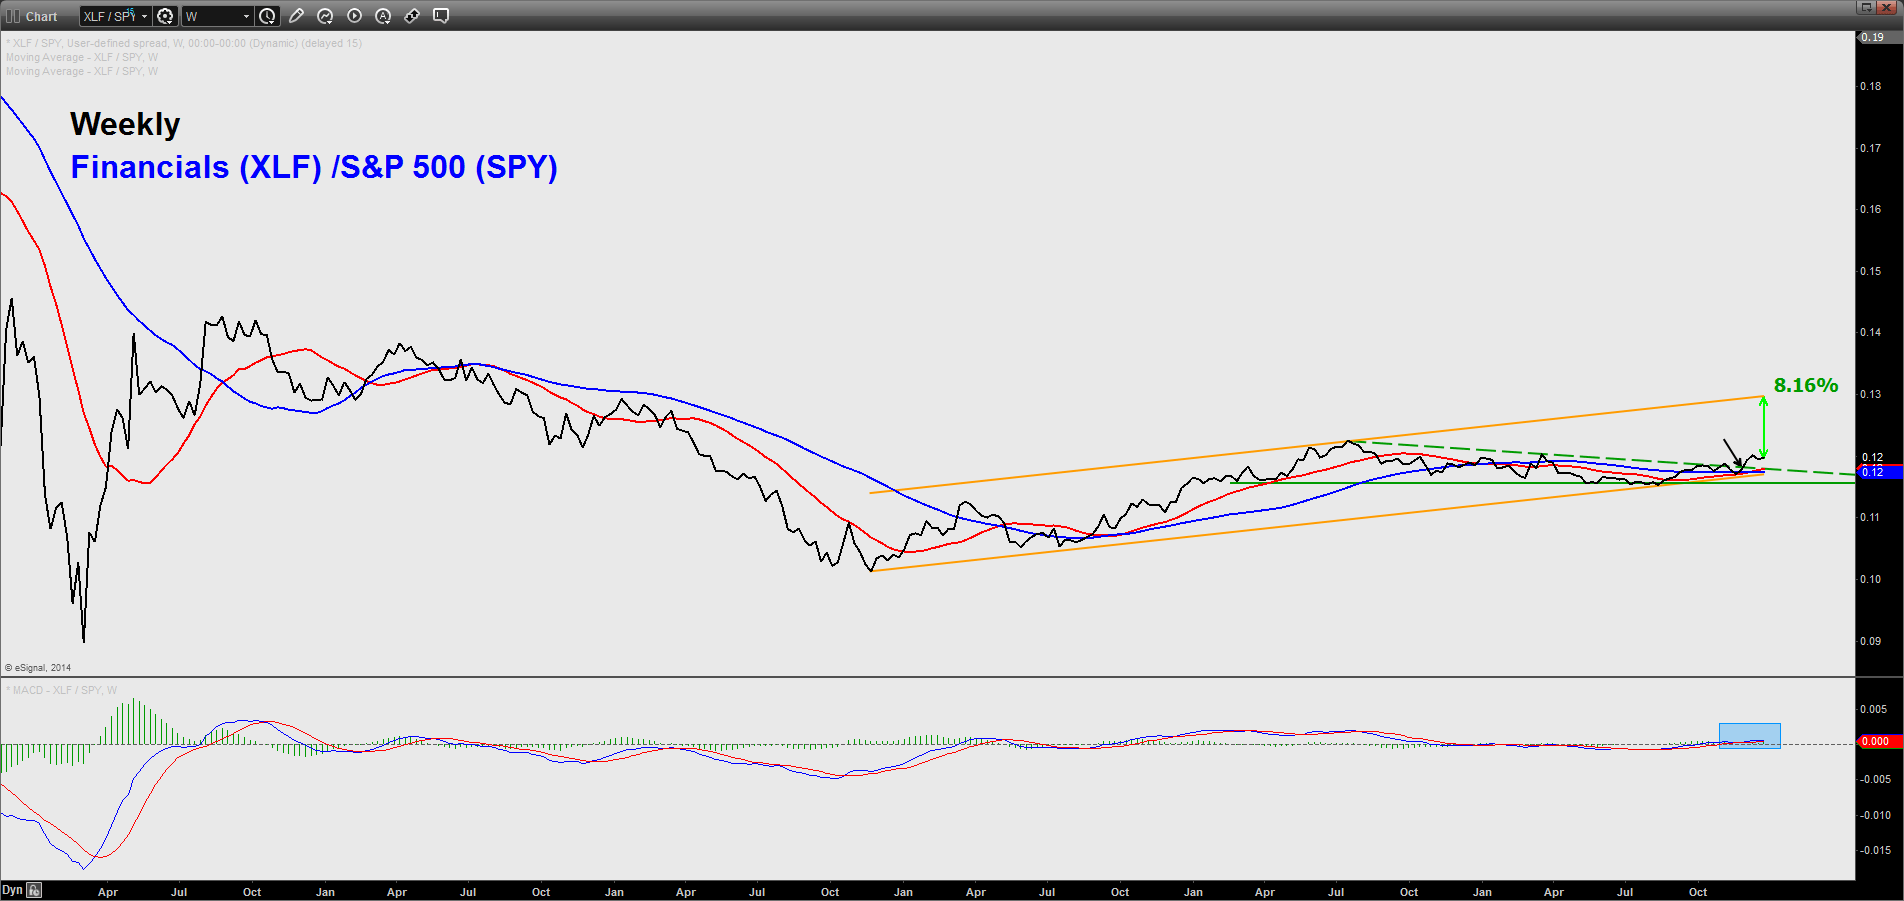
The Financials / S&P 500 ratio has broken above its former trendline resistance and has further upside potential towards the upper boundary of its long-term ascending channel. In addition, the MACD trend indicator has just turned bullish.
Within each of these three sectors (Technology, Consumer Staples & Financials), we have picked the following stocks to watch in 2015 from a technical analysis perspective.
Let’s now take a look at these stocks’ key levels and expected targets.
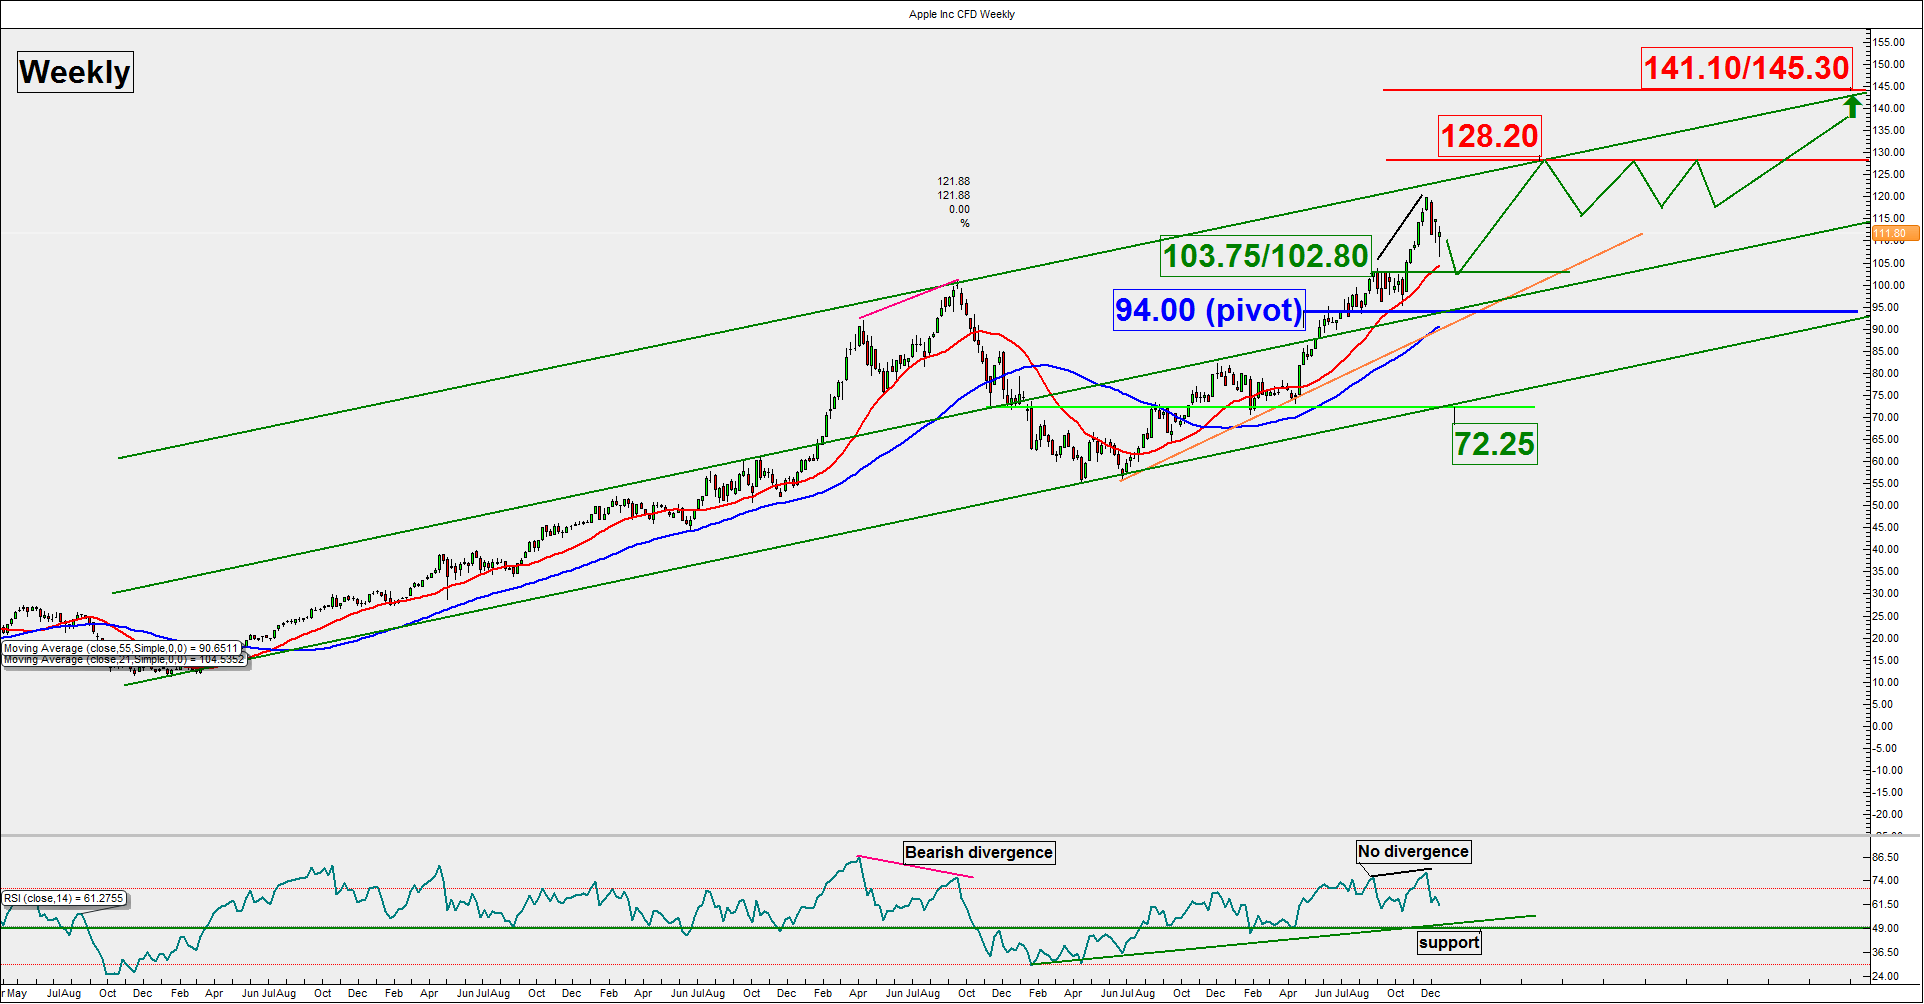
As long as the 94.00 pivotal support holds, Apple is likely to continue its long-term upside movement to target 128.20 before 141.10/145.30. However, a break below 94.00 may negate the bullish tone to see a correction towards 72.25 (lower boundary of the long-term ascending channel).
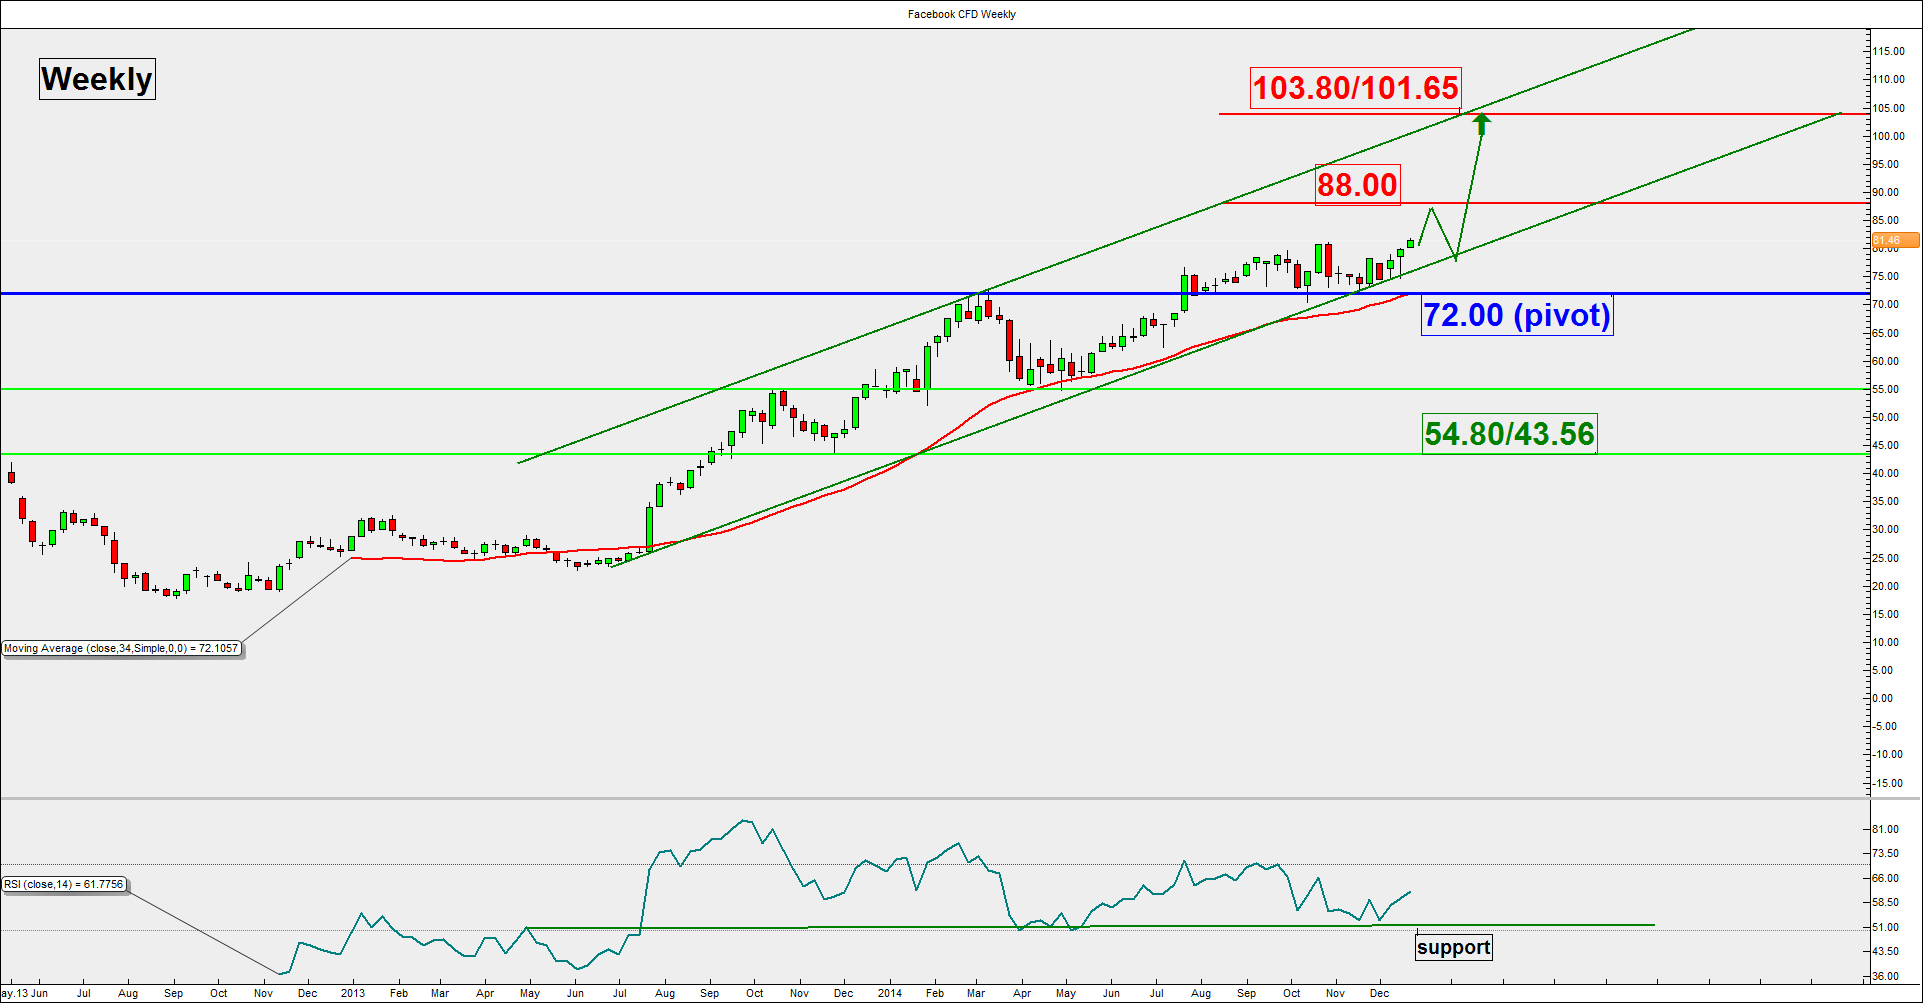
The multi-year bullish trend remains intact for Facebook as long as the 72.00 pivotal support holds. Further potential upside movement is expected towards the 88.00 level before targeting 101.65/103.80. On the other hand, failure to hold above 72.00 may damage the bullish trend to see a correction towards the 54.80/43.56 zone.
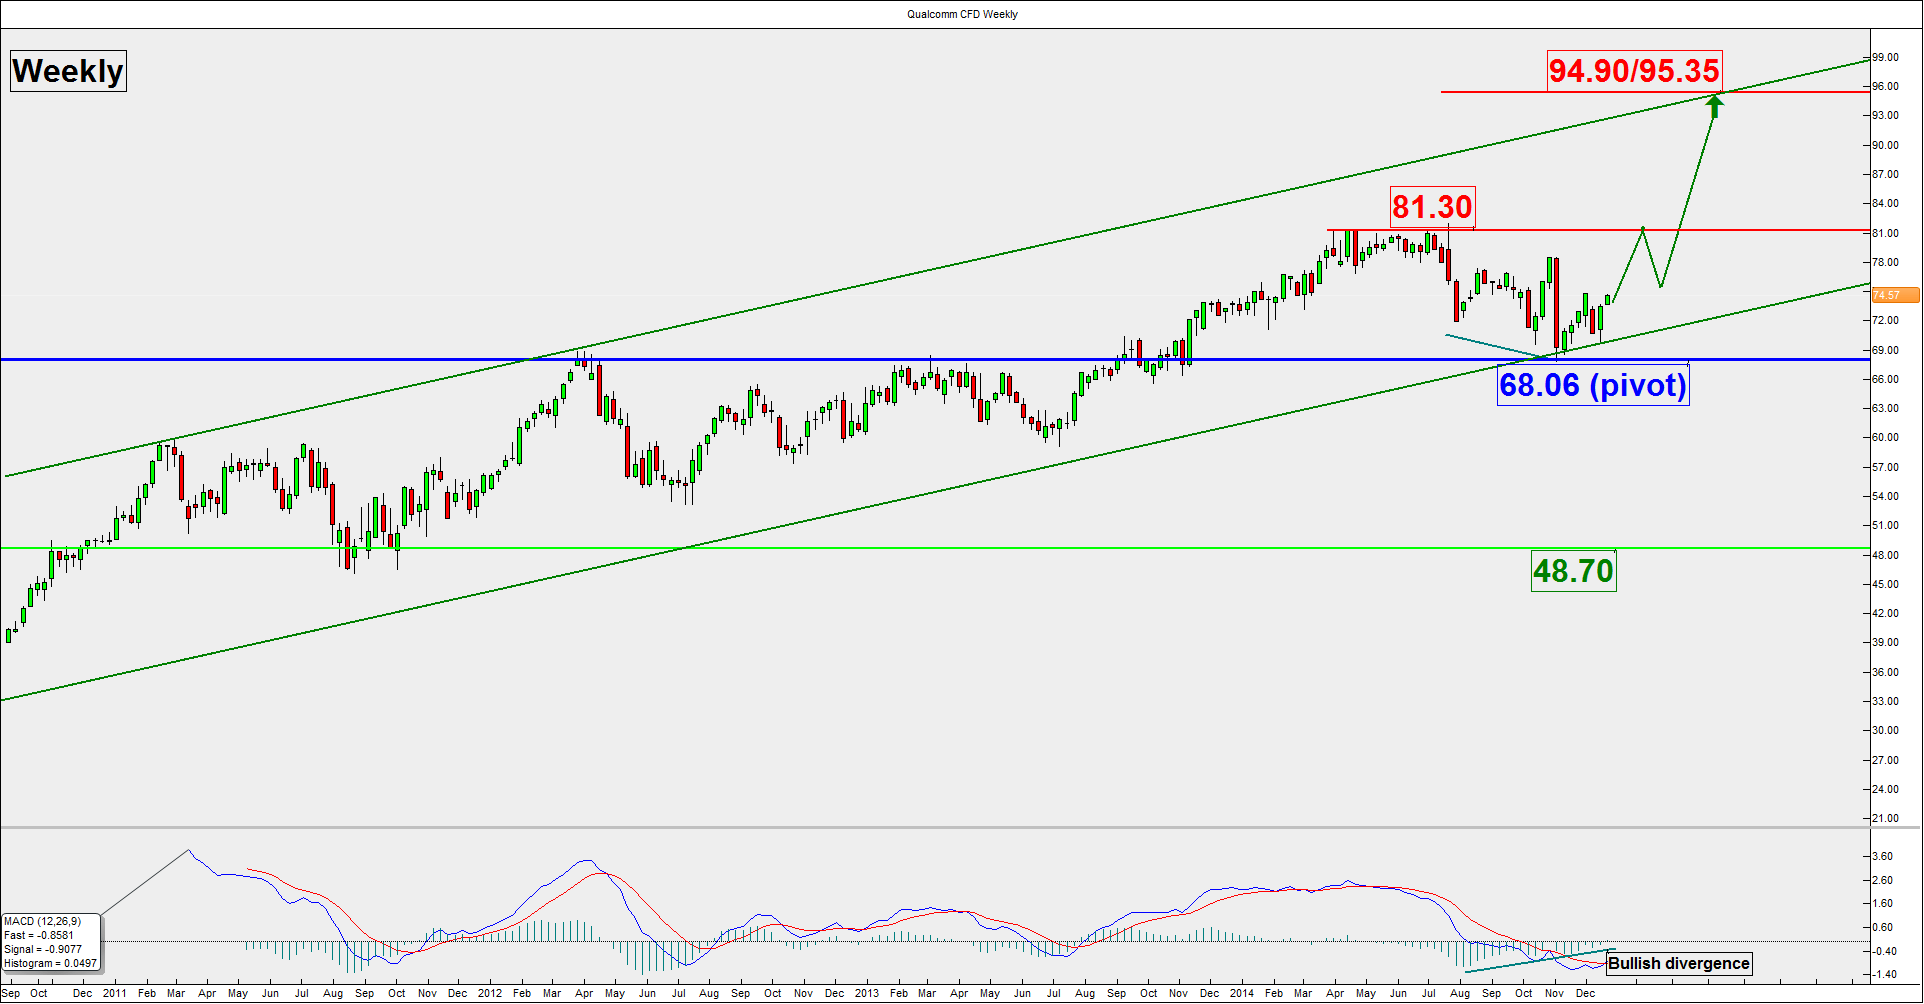
Qualcomm is likely to see another round of upside movement towards its recent swing high at 81.30 before targeting the long-term resistance zone at 94.90/95.35. However, failure to hold above the 68.06 pivotal support may damage the long-term bullish trend to see a correction towards 48.70.
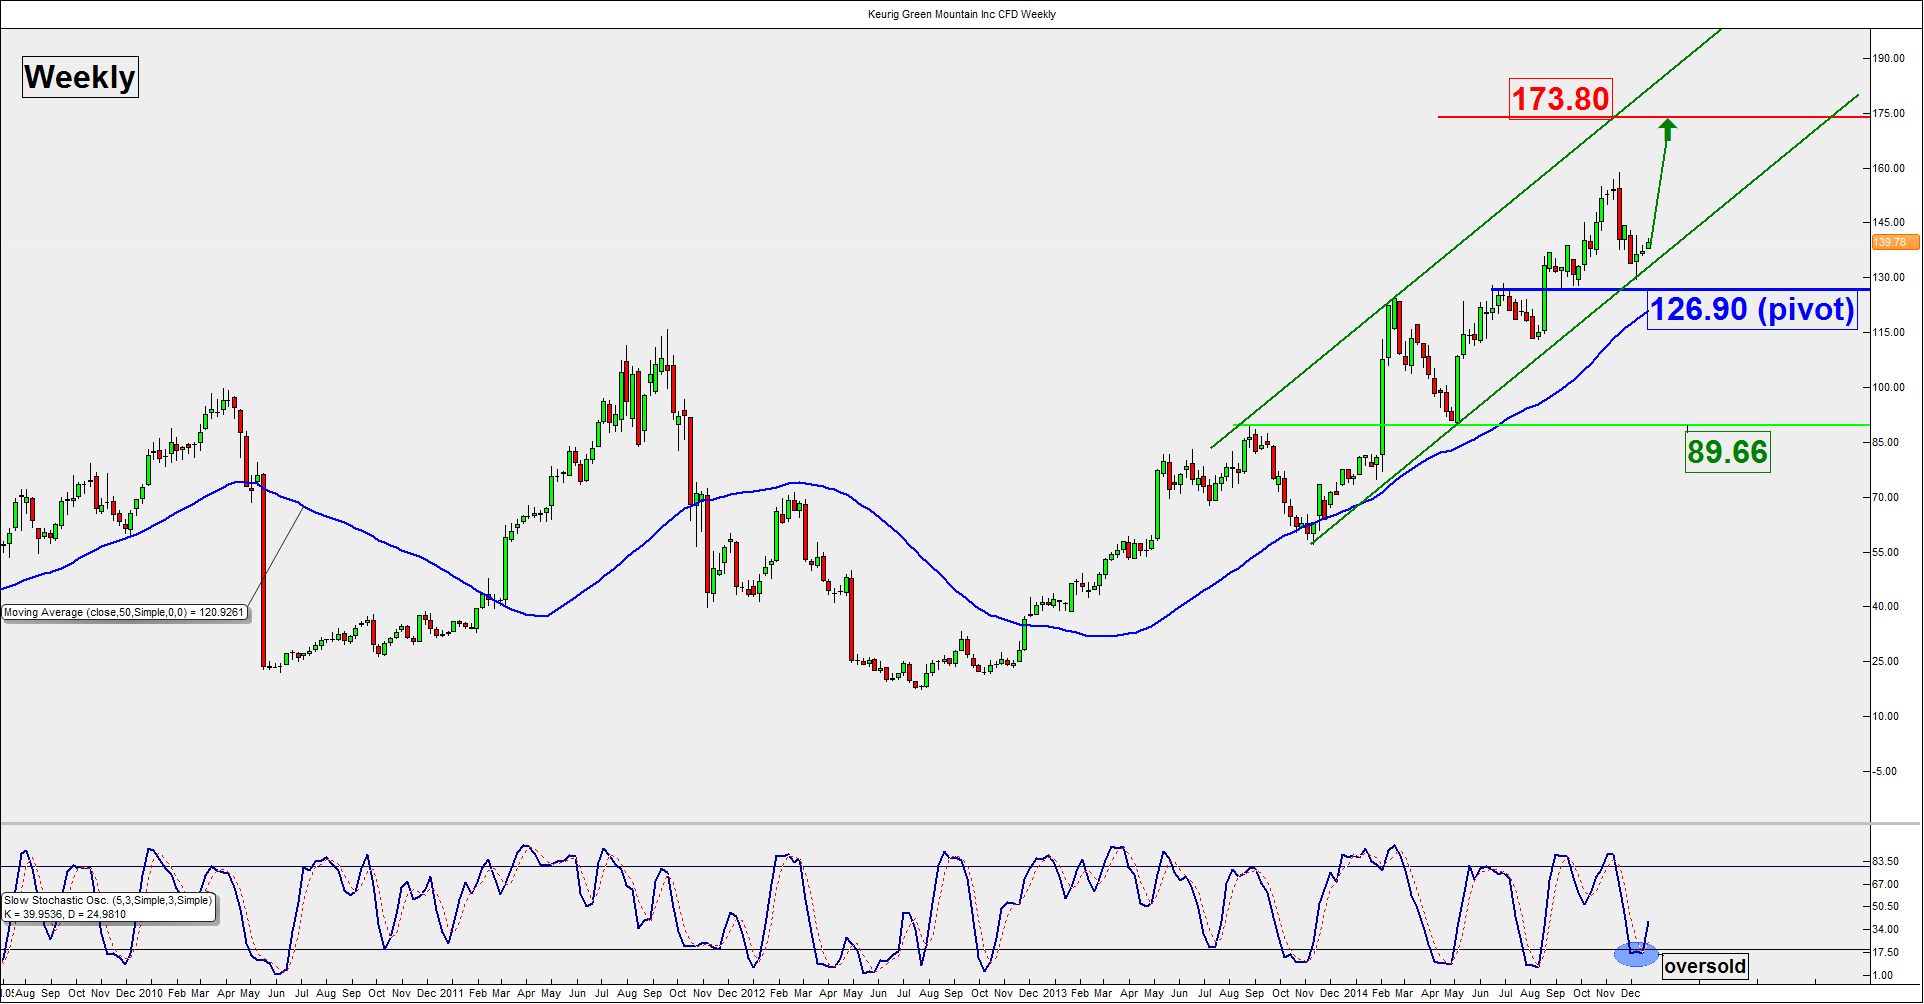
As long as the 126.90 pivotal support holds, Keurig Green Mountain is likely to stage another round of potential upside movement to target 173.80. On the other hand, a break below 126.90 may invalidate the long-term bullish trend to trigger a correction towards 89.66.
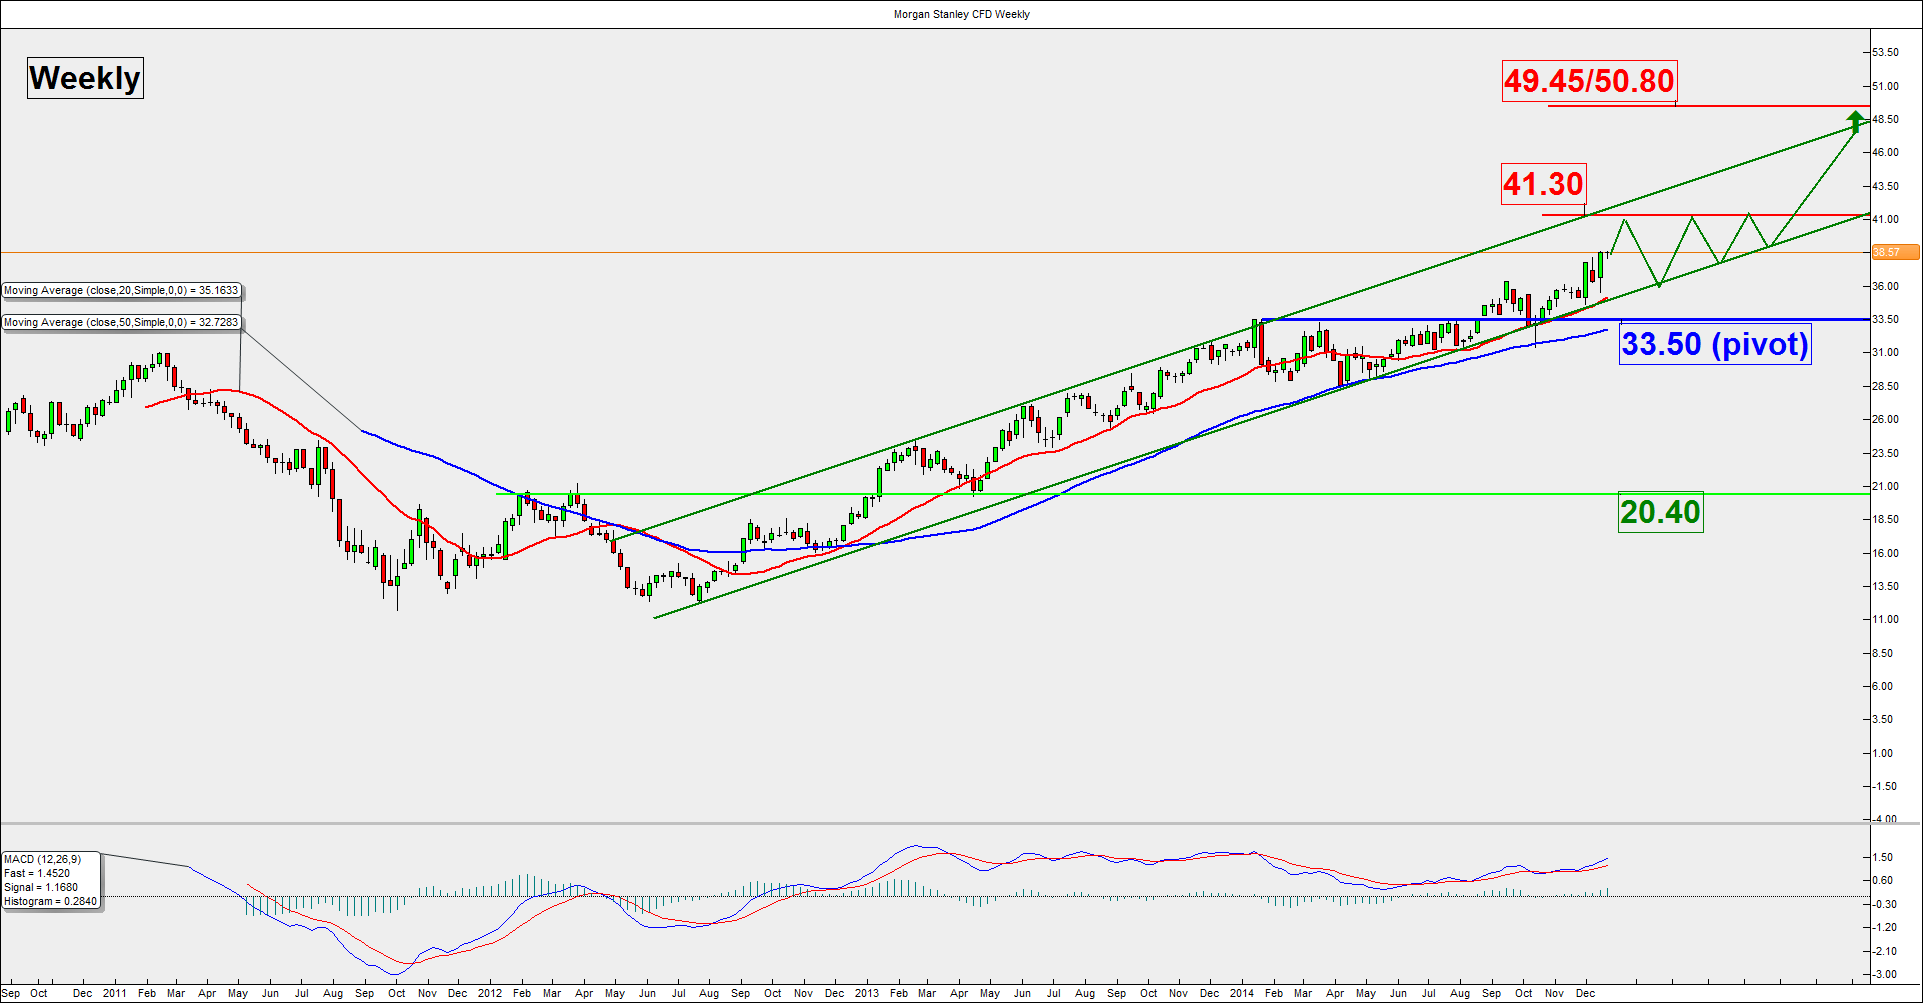
As long as the 33.50 pivotal support holds, Morgan Stanley is likely to continue its multi-year upside movement to target 41.30 before 49.45/50.80. However, a break below 33.50 may damage the bullish trend to see a correction towards 20.40.
These are the stocks to watch in 2015 for those “alpha” seekers trading in the US stock market.
Charts are from City Index Advantage Trader & eSignal
If you found this article useful, you might also want to read Ashraf Laidi’s FX outlook for 2015, his other article on the dangers of underestimating deflation, and James Chen’s technical analysis of indices, currencies and commodities for 2015.
