Keep selling FTSE
The FTSE 100 closed 97.55 points lower, or down 1.4% at 6676.08 on Tuesday, falling further from a 14-and-a-half-year high of 6904.86, reached earlier in […]
The FTSE 100 closed 97.55 points lower, or down 1.4% at 6676.08 on Tuesday, falling further from a 14-and-a-half-year high of 6904.86, reached earlier in […]
The FTSE 100 closed 97.55 points lower, or down 1.4% at 6676.08 on Tuesday, falling further from a 14-and-a-half-year high of 6904.86, reached earlier in September.
This morning, the index has continued to fall, but only moderately.
It’s down 0.3%, as I write this. That’s about 17 points lower around 6659.
The main question for traders of indexes closely based on the FTSE 100 today: is FTSE 100 likelier to keep falling in the near term, or will it bounce soon?
Bears appear to be in charge of prevailing sentiment on the benchmark index right now. Prevailing sentiment should be given a significant weight when we’re considering a relatively short time frame.
On a daily basis there’s little case for the upside on a momentum (Moving Average Convergence Divergence—MACD) or reversion (moving average) basis.
MACD is below the ‘zero’ marker; signal points downwards
However, it’s wise to note the above average aggregate FTSE 100 trading volume of at least 1.5bn.
This suggests a degree of bias and biases tend to unwind.
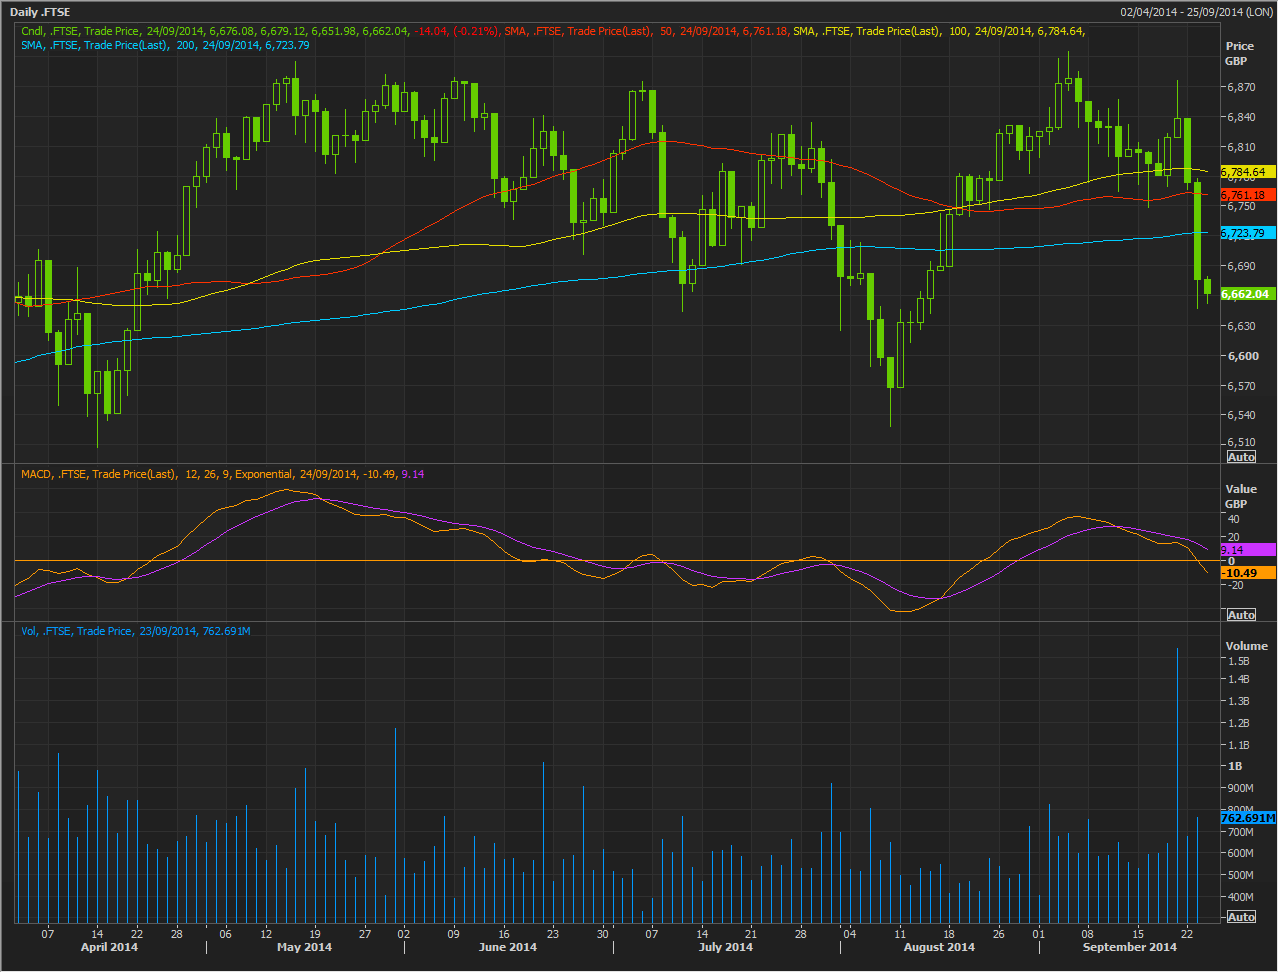
Here we see first signs of dissent in the selling momentum—the MACD’s signal line has marginally inverted.
However, on an hourly basis, the tendency to seek lower FTSE 100 prices is in a much deeper phase of the momentum cycle [MACD system well below zero.]
The MAs are also a mess and trading is taking place well below them as well.
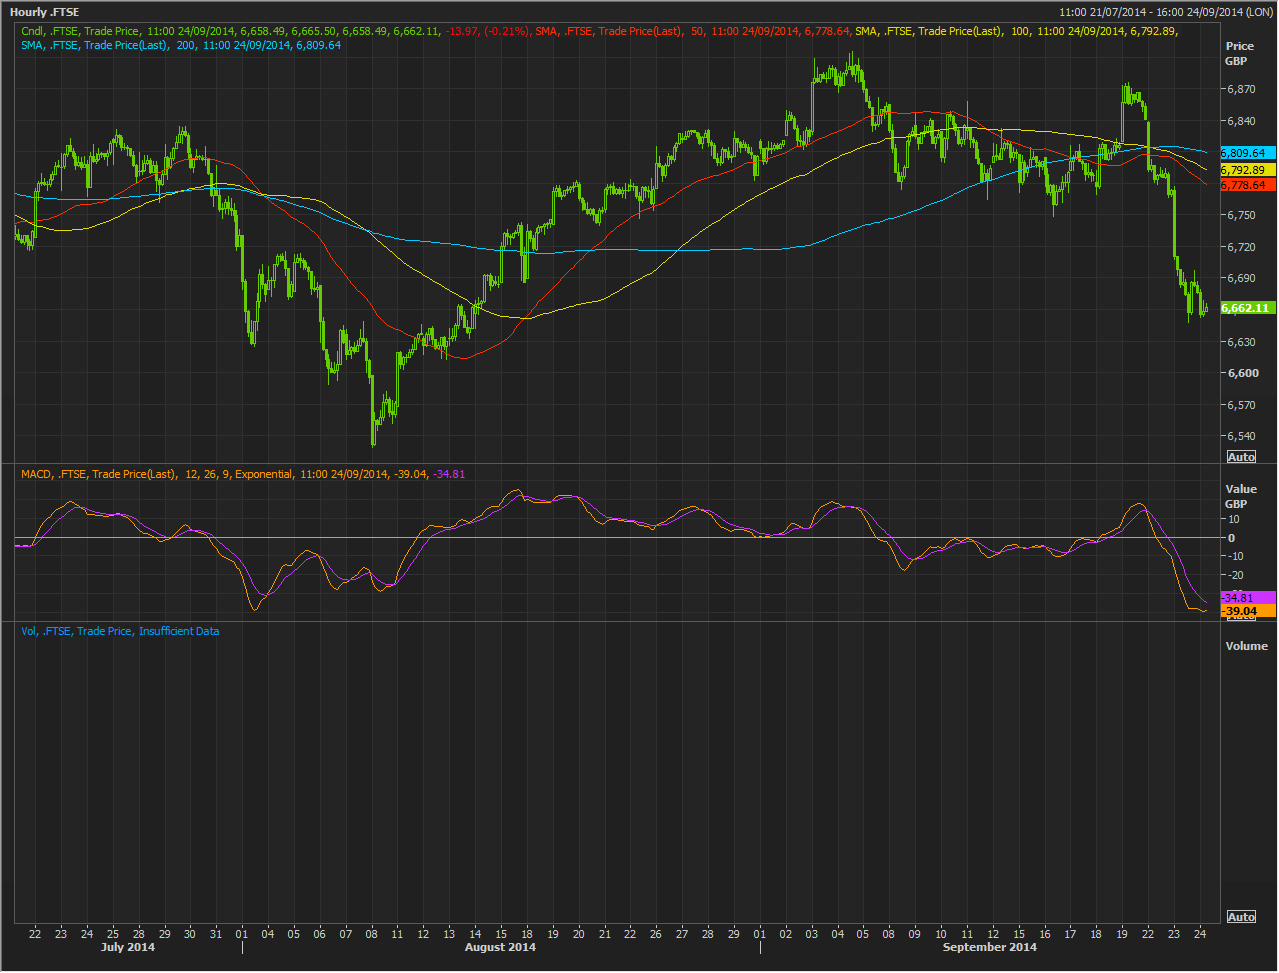
This will be the least reliable picture as regards potential indications for Tuesday’s entire session, though it might provide some pointers for what to do right now.
All other things being equal (and they are, MAs, etc.) our focus again returns to momentum.
If MACD is directing us correctly, selling requires at least a temporary pause.
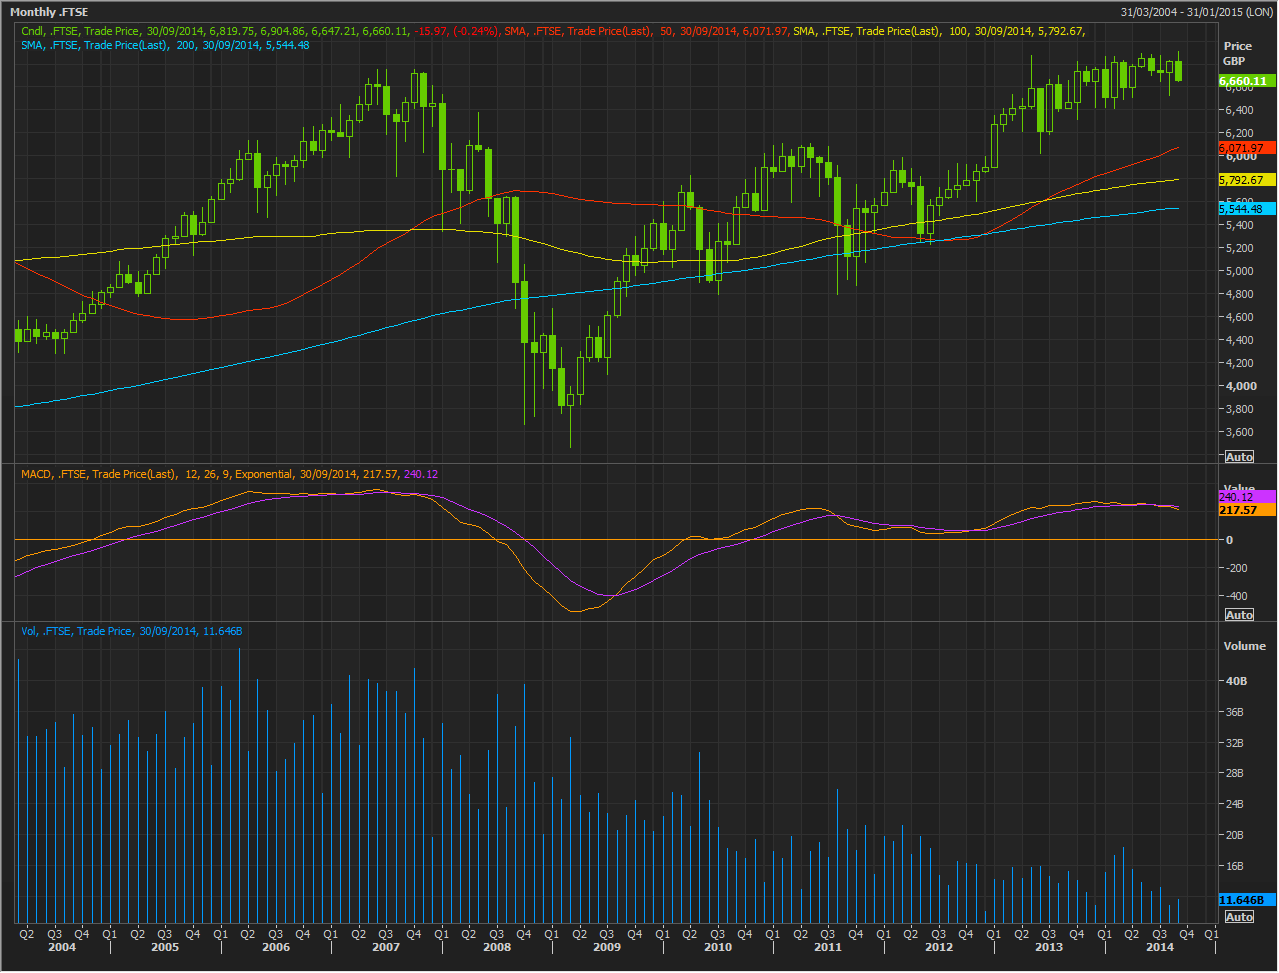
For a quick look at the wider perspective than the above, here is FTSE 100′s monthly chart.
In the slower-motion snapshot prices are still above average for the time frame.
We can see the beginning of impetus is towards downside momentum here (MACD).
But as we’re still above the zero barrier the bias for falling prices is not strong, on a monthly basis.