James Chen Technical Analysis of Indices Currencies and Commodities for 2015
UK100 The UK 100 (daily chart shown above), which tracks the FTSE 100, spent the fourth quarter of 2014 in a wild, choppy ride that […]
UK100 The UK 100 (daily chart shown above), which tracks the FTSE 100, spent the fourth quarter of 2014 in a wild, choppy ride that […]
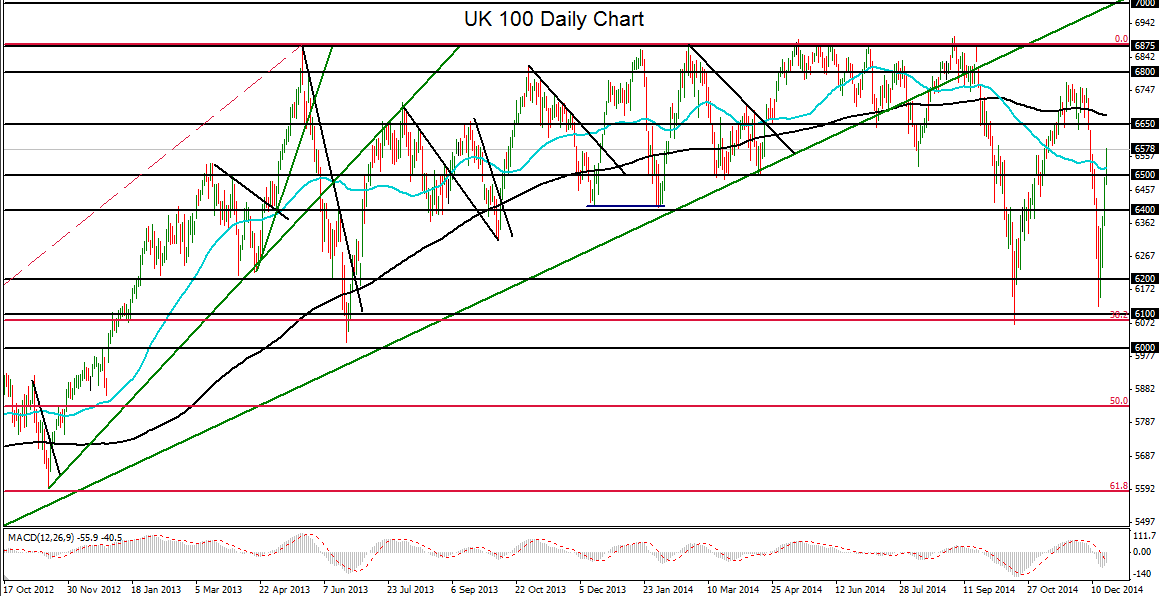
The UK 100 (daily chart shown above), which tracks the FTSE 100, spent the fourth quarter of 2014 in a wild, choppy ride that began with the UK’s benchmark equity index falling dramatically from its new 14-year high of 6905 in early September.
The sharp decline lasted for more than a month, by which time the UK 100 had plunged to an extreme depth of 6070 in mid-October, establishing more than a one-year low.
From there, the rebound and recovery was almost as dramatic as its fall. In little more than a month, the index climbed sharply to hit a high of 6772 by late November.
After a brief consolidation of its gains, the UK 100 plummeted yet again starting in early December. This plunge dropped the index close to its October bottom, hitting a low around 6122 by mid-December.
Rounding out 2014, the UK 100 has spent the latter half of December thus far in a sharp relief rally along with other major global indices, particularly the US benchmark equity indices.
The long-term trend for the UK 100 continues to be bullish, despite the dramatic declines and choppy nature of the past quarter.
Globally, equities have risen substantially on a net basis within the past year, and should continue to see gains going into 2015.
The key upside level to watch continues to reside around the 6900 level, which is near the multi-year highs for the index and a major resistance area. If that level is broken to the upside, a new all-time high around 7000 should be the new bullish target to shoot for in early-to-mid 2015.
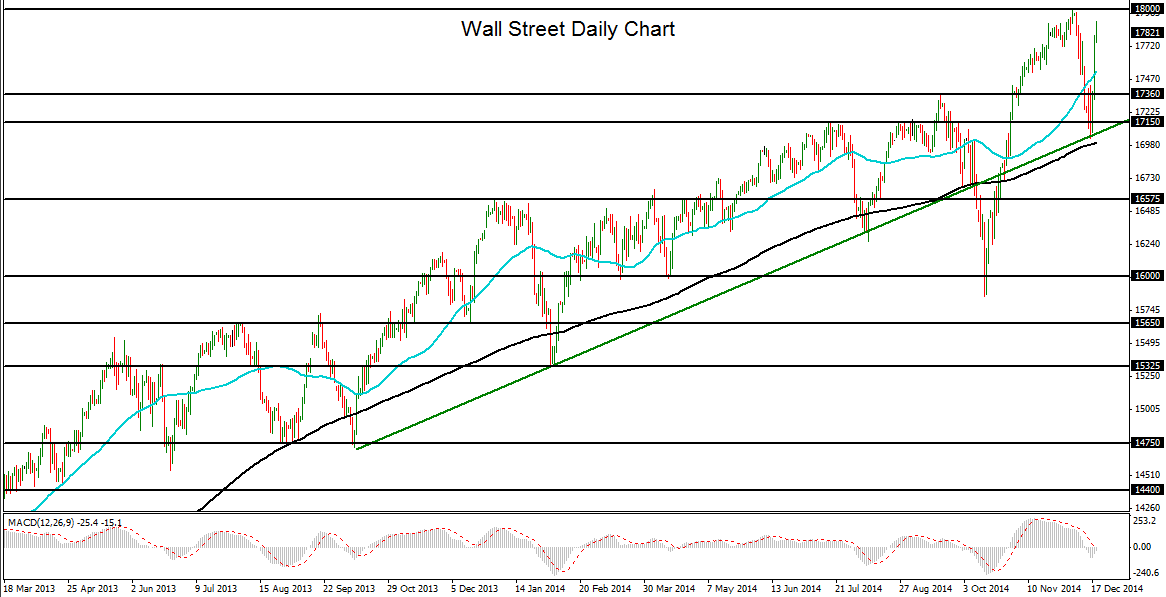
Wall Street (daily chart shown above), which tracks the Dow Jones Industrial Average, spent much of 2014 in a dramatic bullish trend.
The major pullbacks within this uptrend occurred in January, July, October, and the first half of December. The October pullback was the most drastic, with almost a 9% drop within the span of less than a month.
Despite these four major pullbacks, Wall Street is set to end 2014 substantially higher than it started, having gained approximately 8% as of late December from the beginning of the year.
The most recent all-time high for the index was around 17,990, just short of 18,000 psychological resistance, which was hit in the first week of December.
After that high was reached, the index made a corrective plunge that brought it to a low of around 17,030 in mid-December before rebounding sharply.
As of late December, Wall Street has re-approached its noted all-time high around 17,990 and appears poised to break it to the upside.
The long-term bullish trend clearly remains intact for Wall Street, as well as its other benchmark index counterparts.
Going into the beginning of 2015, on any significant breakout above the noted resistance around 18,000, the next major target to the upside resides around the 19,000 level.
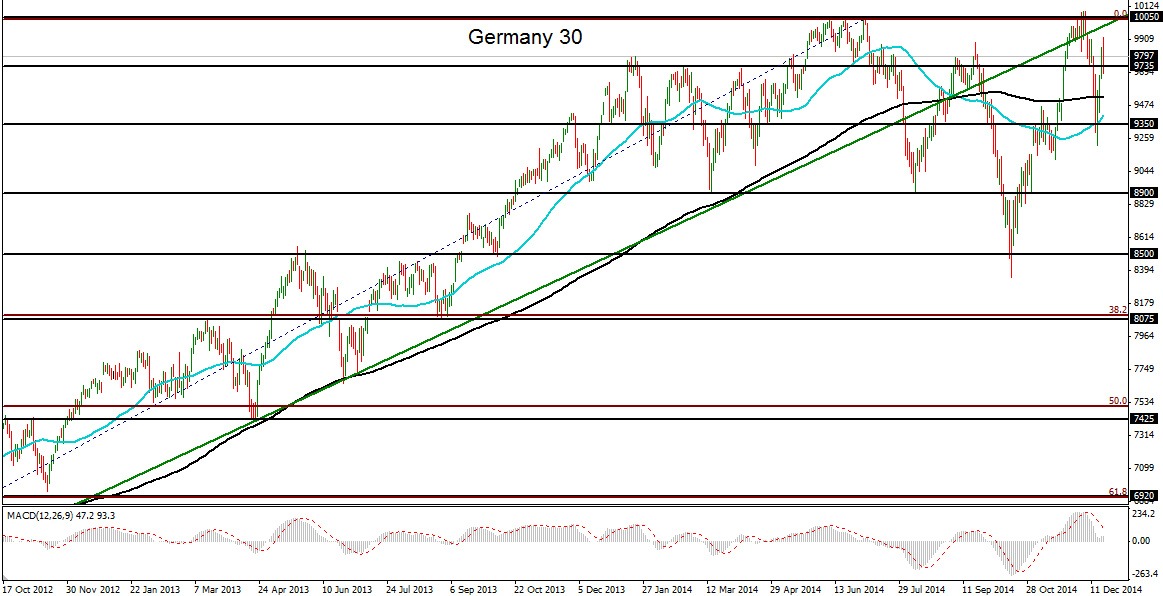
The Germany 30 index (daily chart shown above), which tracks the German DAX, experienced all of the choppiness and volatility in 2014 that its other equity index counterparts withstood, most notably the UK 100 (FTSE 100).
Germany 30 became particularly volatile beginning in the latter half of the year when the index tumbled from its key resistance area around 10,050. It then spent the rest of the year making strong, conflicting runs in either direction.
The major low of 2014 was established around 8350 in mid-October. That low was the result of a staggering decline of 15% in less than four weeks from mid-September to mid-October.
After that low was hit, Germany 30 went on to stage an unprecedented comeback for the next month-and-a-half that pushed the index up to a new all-time high above 10,090 in early December, slightly above the noted 10,050 resistance area.
From that high, Germany 30 retreated until mid-December, when it turned back to the upside in the global equity rebound and began to re-approach the new all-time high once again.
Despite the large, volatile swings in the latter half of the year, Germany 30 is still very strongly entrenched within a long-term bullish trend.
Going into early 2015, on any significant breakout above the new 10,100 resistance area, the next major resistance target to the upside resides around the 10,500 level.
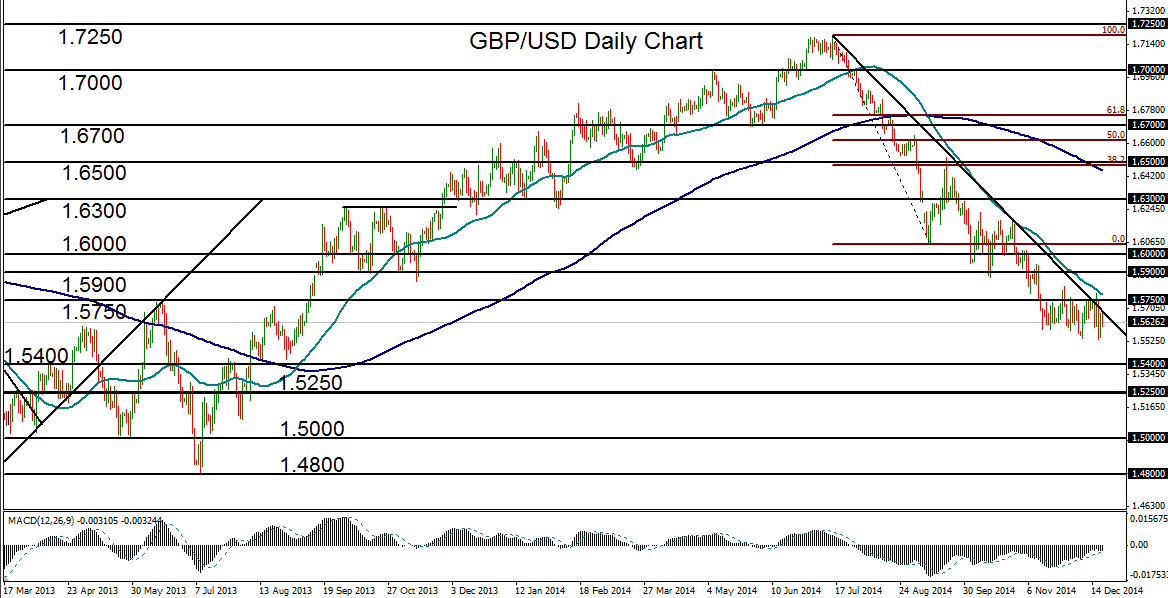
GBP/USD (daily chart shown above) has been entrenched within a persistently steep bearish trend for much of the latter half of 2014, since the multi-year high of 1.7190 was hit in mid-July.
As of late December 2014, this downtrend has erased all of the gains made prior to July’s high. From the July 1.7190 high down to December’s 1.5540 low, the currency pair declined by almost 10% within the span of only five months.
Since the beginning of the downtrend, GBP/USD has faithfully followed a steep descending trend line. The 50-day moving average has also provided a key descending resistance line.
Moving into 2015, persistent US dollar strength should continue to weigh on GBP/USD, potentially pushing the prevailing downtrend to new lows.
Carrying a significant bearish bias into the New Year, GBP/USD could soon be poised to break down below December’s one-year low, which would confirm a continuation of the bearish trend. In this case, the next major downside support targets reside around 1.5400 and 1.5250, and then potentially towards the 1.5000 psychological level.
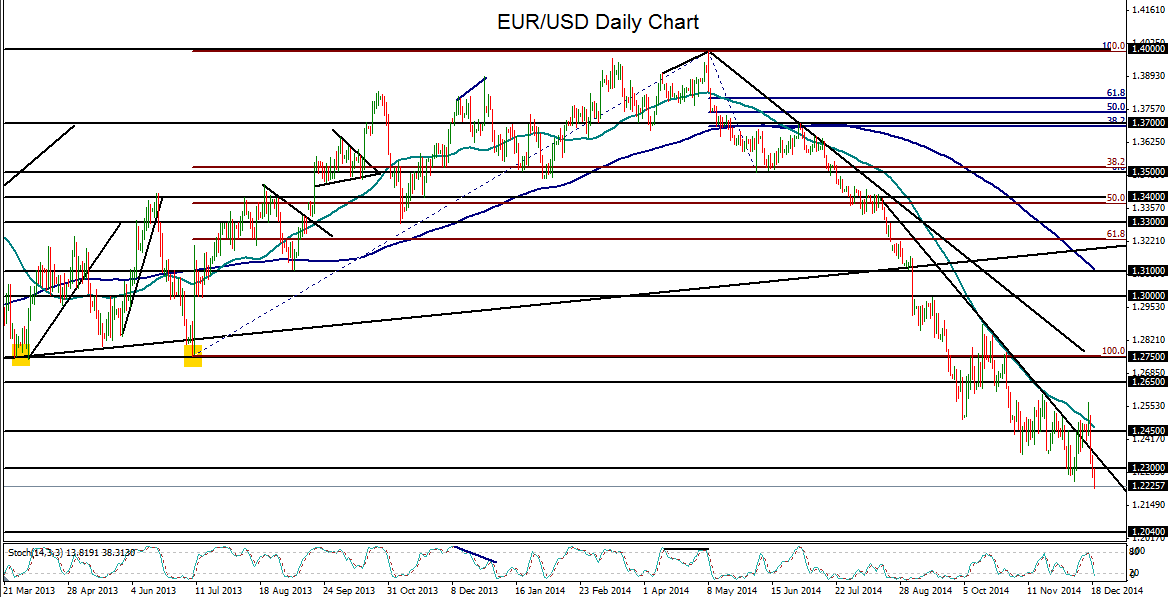
EUR/USD (daily chart shown above) has reached down to hit a new two-year low just above the 1.2200 level as of late December 2014. This low was the culmination of a second half of 2014 that was marked by an exceptionally bearish trend for the currency pair.
From early May’s two-and-a-half year high around the 1.4000 handle down to the noted December low around 1.2200, EUR/USD tumbled by almost 13% in the span of only seven months.
During the course of this strong downtrend, the currency pair broke down swiftly below many major support levels, including 1.3700, 1.3500, 1.3000, 1.2750, and most recently, 1.2300.
Major pullbacks within this downtrend were relatively few and far between. The two noteworthy rebounds occurred in October and early December, but both failed to substantially disrupt the entrenched downtrend.
Most recently, since mid-December, EUR/USD ended its latest rebound and proceeded to drop down to hit its noted long-term low around 1.2200, confirming a continuation of its long entrenched bearish trend.
Going into 2015, EUR/USD continues to carry a strong bearish bias. With most bearish targets already hit through the latter half of 2014, the next major downside target resides around the 1.2040 level, the pivotal low that was hit in mid-2012. Below that support is the 1.1875 level, last hit in mid-2010.
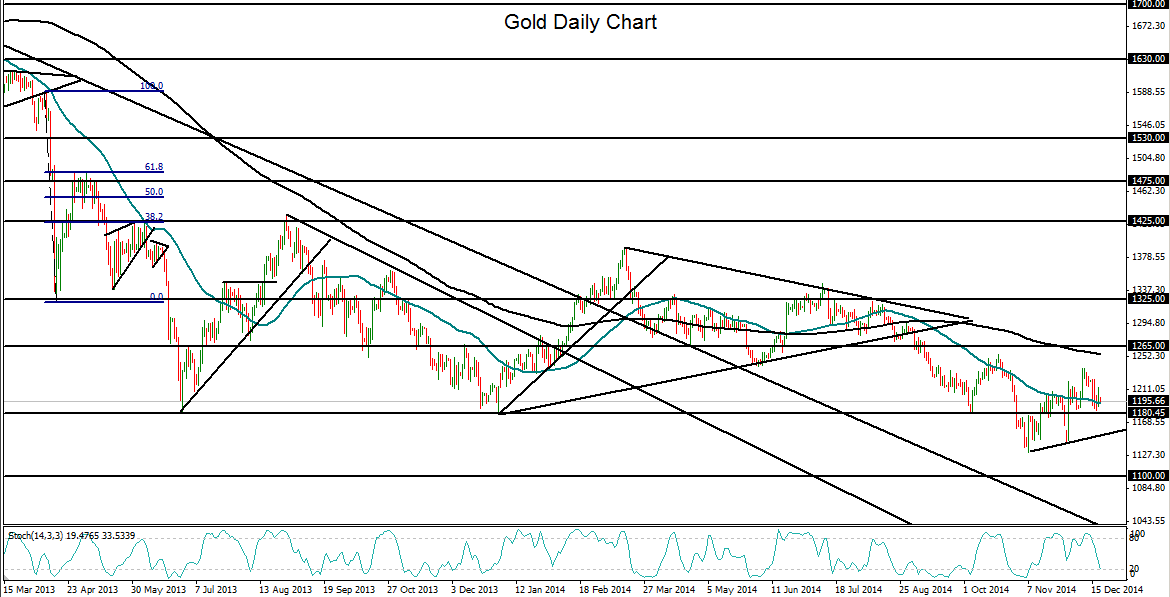
Gold (daily chart shown above) began 2014 only slightly higher than the price at which it is currently poised to end the year, as of late December. This is in stark contrast to 2013, when the precious metal declined dramatically in value.
The first quarter of 2014 was marked by what initially appeared to be a rebound and recovery from the 1180-area double-bottom low.
Price action reached a substantial high of 1392 after the end of the first quarter, before spending the rest of 2014 drifting back to the downside.
A third 1180-area bottom was established in early October, which held temporarily with a modest rebound. But the end of October saw the 1180 level broken swiftly to the downside.
A four-year low around 1130 was hit in early November, at which time the price of gold bottomed for the time being and began to rise back up to less extreme levels. This rise, though continuing to show significant volatility, generally persisted towards the end of the year.
Although the long-term trend for gold continues to be to the downside, 2014 has shown that the precious metal has been oversold and has resisted declining much further. As noted, gold began the year 2014 around 1200 and should end it not too far from that level.
While a lower downside target resides around the 1100 level, 2015 should see at least another attempt at a recovery from the current long-term depths. In this event, the key upside resistance targets to watch for include 1325 and then 1425.
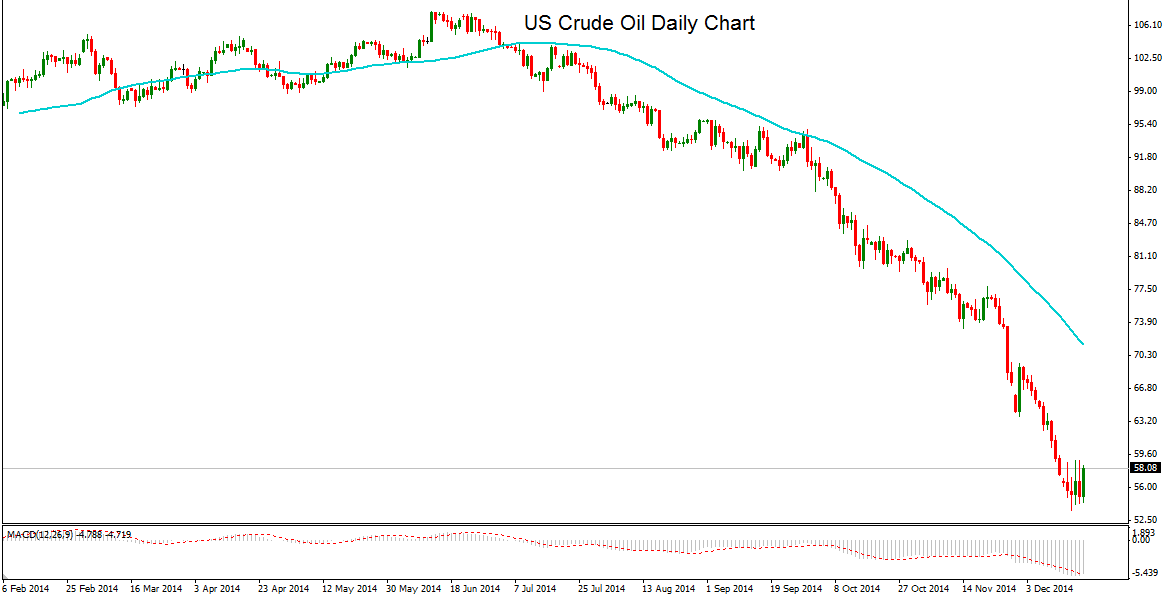
US crude oil (daily chart shown above) has reflected the most prominent market story of the fourth quarter of 2014. Unfortunately, this global narrative has been due to the remarkable plummet in oil prices that has had many different, and potentially disastrous, ramifications around the world.
The plunge began in the middle of the year when US crude oil hit a 2014 high of 107.64 in June. This high was followed by a quick retreat and then a subsequent dive that continued for the rest of the year.
Early on during the course of this dive, crude oil fell below its 50-day moving average and has not yet had a relief rally of sufficient magnitude to climb even briefly back above this key moving average.
The latter half of 2014 has essentially been a one-directional run to the downside, where key support levels were swiftly violated and no bottom seemed to be in sight.
After the 90 level was breached to the downside in early October, US crude quickly descended to 80, then 75 and 65, hitting progressively lower five-year lows on a regular basis.
In December, price action finally dropped below 60 and then went on to establish a new five-year low of 53.60 by mid-December before consolidating its losses in range-bound trading near the lows, as of late December.
While the downtrend for the latter half of 2014 was swift and unrelenting as oil supplies increased while demand decreased, crude oil prices should find a bottom and begin to stabilize in early 2015.
Although further lows down in the 40’s may well be seen, any further plunge of the like that was seen during parts of 2014 is unlikely.
Going into 2015 with crude oil already well oversold, a key upside target on a rebound and recovery for the New Year resides around the 75 price level.
If you found this article useful, you might also want to read Kelvin Wong’s notes on US stocks to watch next year, Ashraf Laidi’s 2015 FX outlook and his article on the dangers of underestimating deflation.
