


August 28, 2019 5:39 PM
It’s Wednesday during the Last Week of Summer…..Look at the Long-Term Charts
It’s the end of summer, the last “unofficial” week of summer in the US, that ends with Labor Day Monday. Many people in the US and the UK have taken the week off. Traditionally, this is one of the slowest weeks for trading of the year. Besides a few headlines, including one of which is that a government has been formed in Italy, markets are extremely quiet. Most of the USD pairs, with the exception of the GBPUSD, are locked in a tight trading range for the day, and perhaps the rest of the week!
Question: What do you do to keep yourself busy, to make yourself a better trader, to help take more pips out of the market during slow times?
Answer: REVIEW LONGER-TERM CHARTS TO DETERMINE A DIRECTIONAL BIAS
Here are a few:
EUR/USD (monthly), current level 1.1076:
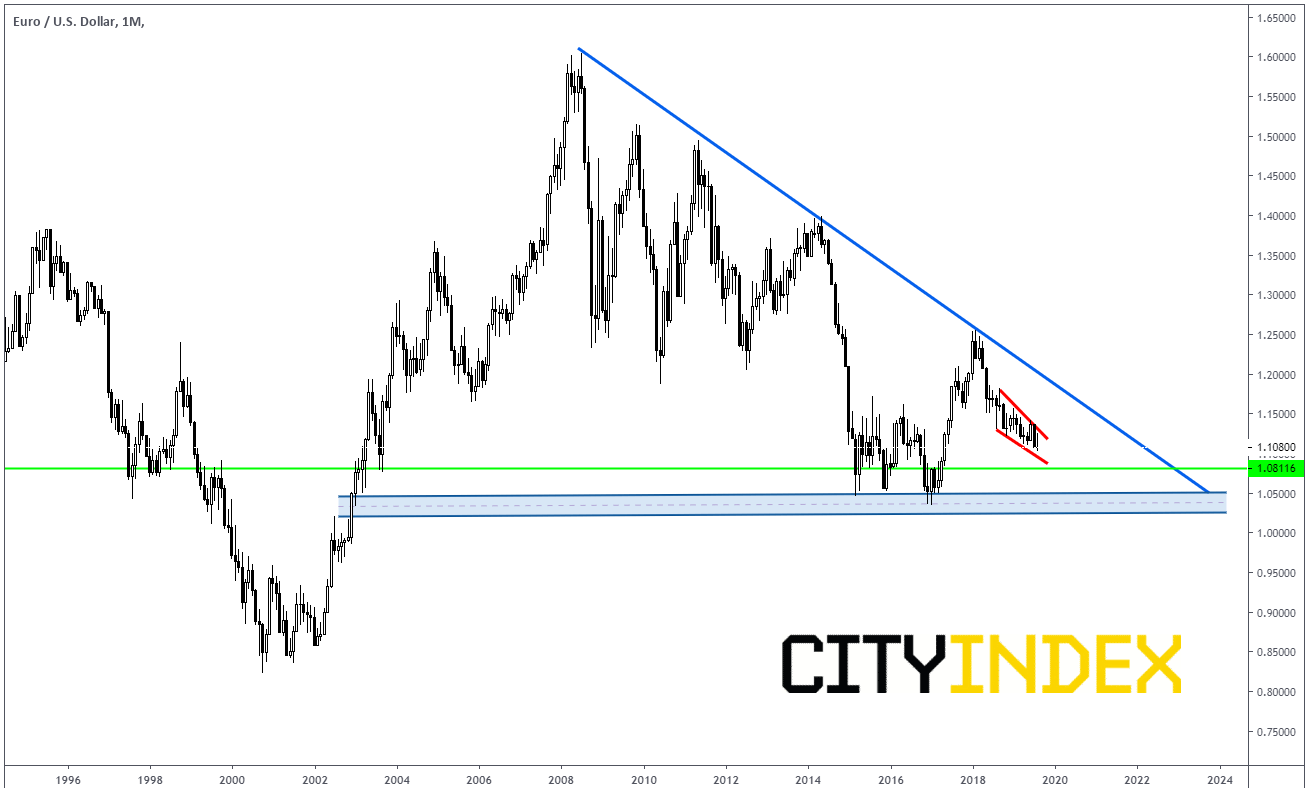
Source: Tradingview, City Index
EUR/USD is currently in a downtrend that began in July of 2008. Over the course of the last year, price has been putting in lower lows and lower highs, creating a descending wedge. If price breaks above the falling wedge, it can move to the descending trendline near 1.1800. If price continues lower, support comes in around 1.0800, then an area of support between 1.0500 and 1.0250.
NZD/USD (monthly) current level 0.6334:
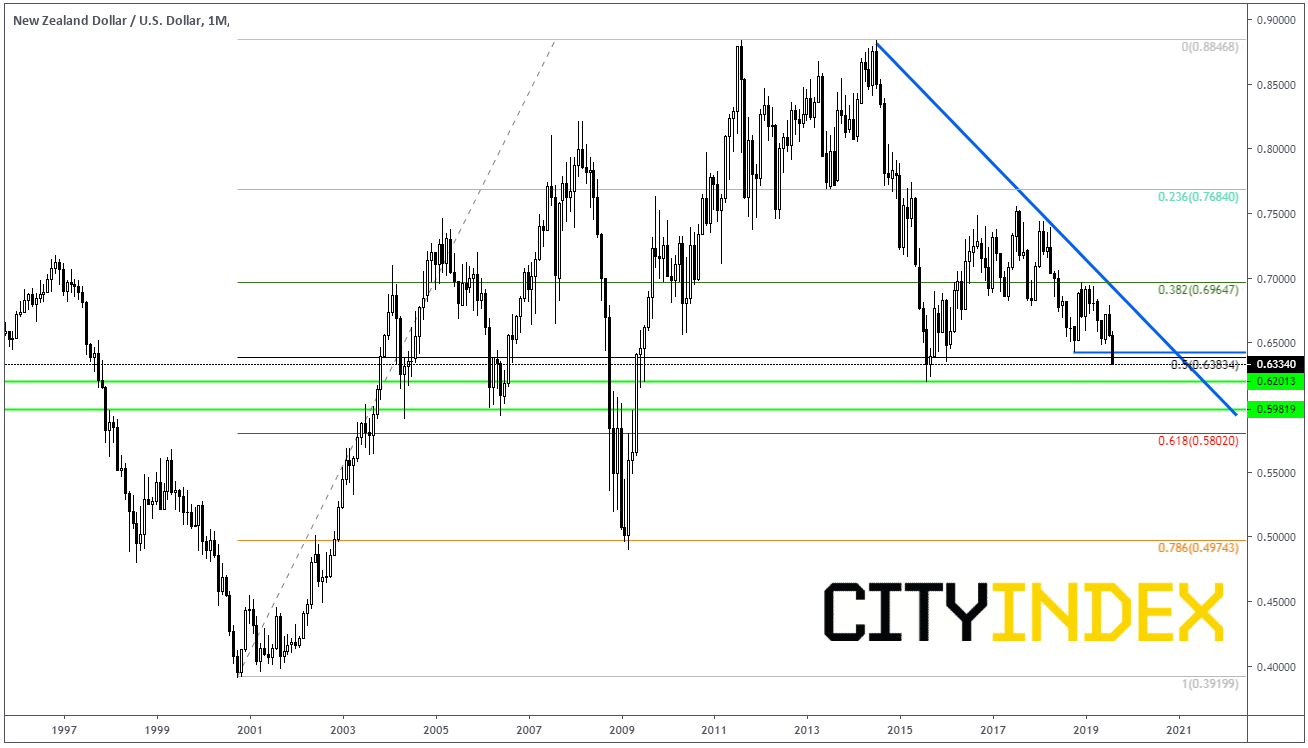
Source: Tradingview, City Index
NZD/USD has been in a downtrend since August 2014. This month, the pair took out the lows from October 2018 near 0.6440 and continues to show little signs of life. Next support is at 0.6200. Below that the pair can trade down to 0.6000, then 0.5800, which is the 61.8% retracement from the November 2001 lows to the August 2014 highs. Resistance on the upside now comes in at those October 2018 lows near 0.6440, then the descending trendline near 0.6700.
USD/CAD (monthly) current level 1.3301:
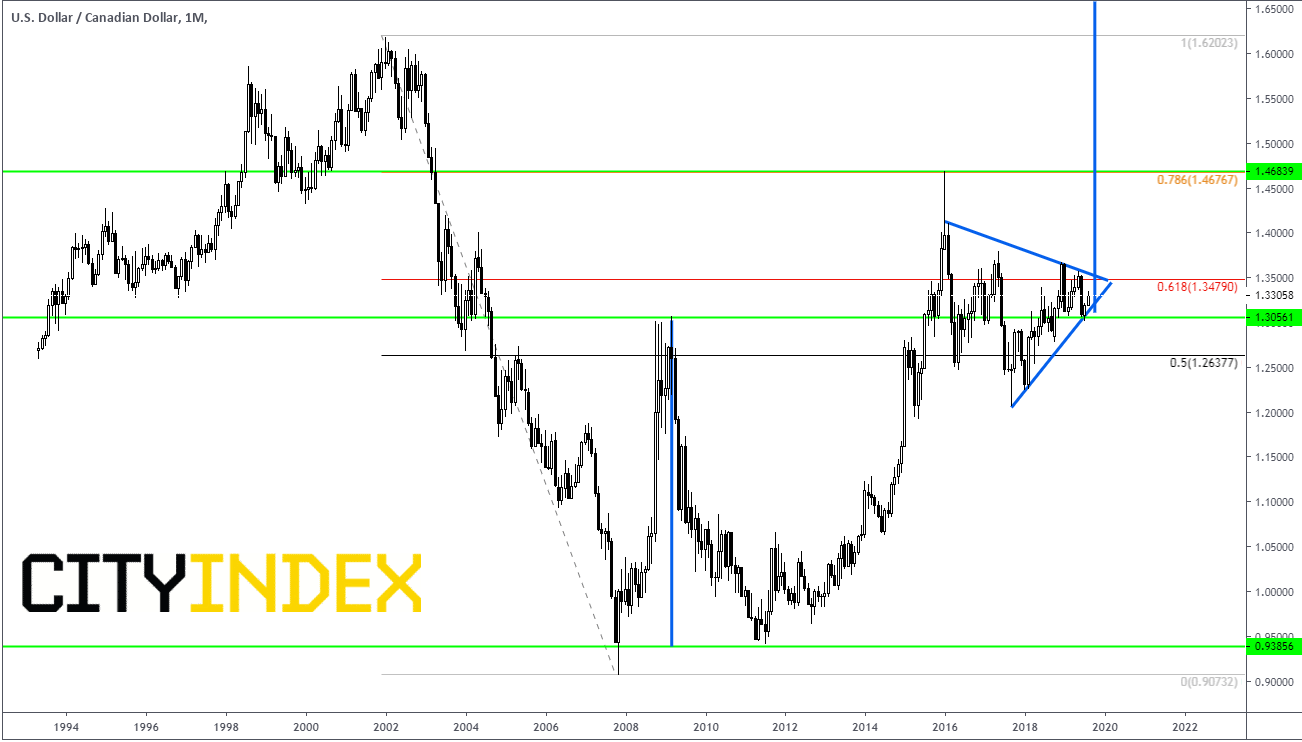
Source: Tradingview, City Index
USD/CAD has been in an uptrend since putting in a double bottom back in July 2011. Price retraced most of the move from the January 2002 highs down to the July 2011 lows. Price has been trading roughly between the 50.0% retracement (1.2637) and the 61.8% retracement (1.3500) since January 2016. As the pair coils inside the triangle, it may be ready for a breakout, and continue towards the target of the long-term double bottom. Current resistance is at 1.3500 which is trendline resistance, then 1.4683, which is the high of the evening star formation from January 2016 and the 78.6% retracement of that long term move from 2002-2011. Approximate long-term target of the double bottom is 1.6500!
USD/JPY (monthly) current level 106.17:
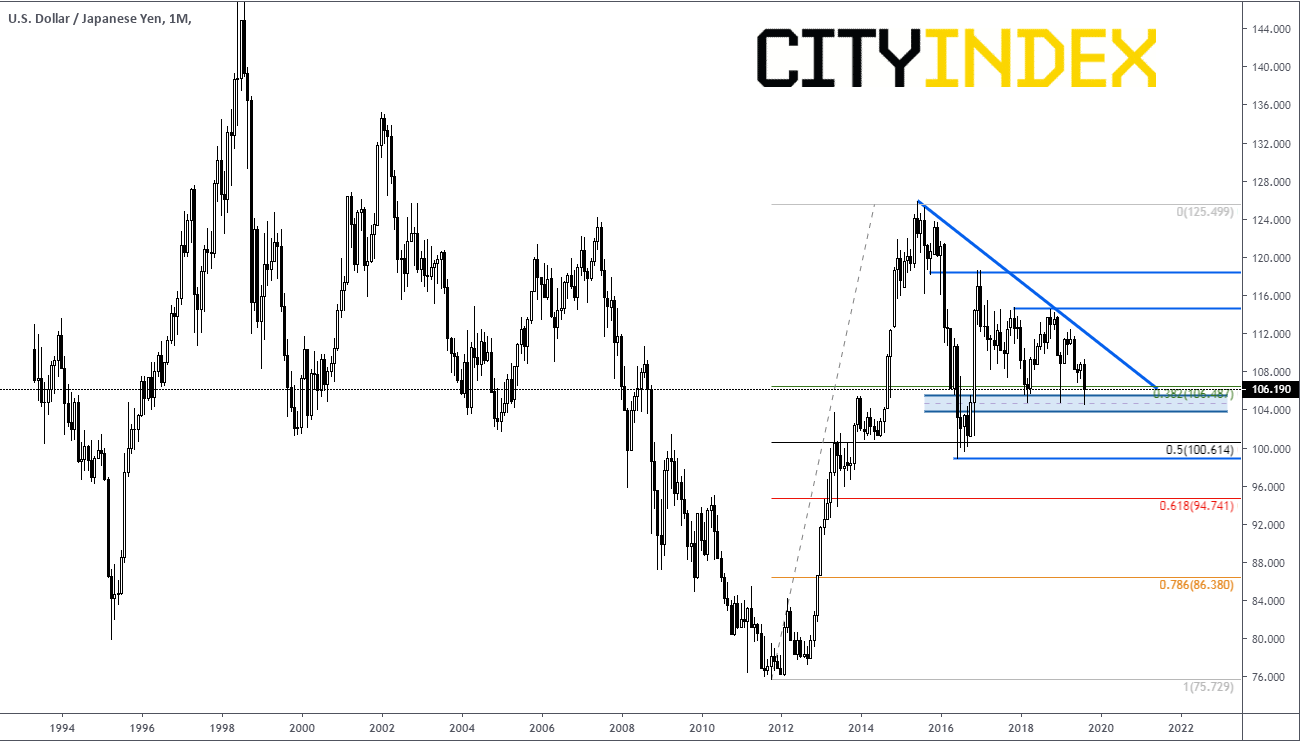
Source: Tradingview, City Index
USD/JPY bounced from 76.00 back in October 2011 to 125.50 in June 2015. Since then, it retraced 50% of that move and has been forming a triangle. Price has been trading in the upper half of the triangle since November 2016 and has been creating great resistance/support between 103.80 and 105.50. A break through these levels may bring in a host of selling down to near 100.00. Immediate long-term resistance comes in at the downward sloping trendline near 111. Above that, there is horizontal resistance at 114.40, then 118.00
In summary, when it’s a Wednesday afternoon at the end of summer and the markets are slow, take a step back and view the longer-term charts. Some levels may stand out, which you may not have taken notice of in the shorter-term charts.
Latest market news
Yesterday 11:48 PM
Yesterday 11:16 PM
Yesterday 05:00 PM
Latest Dollar articles

February 16, 2024 11:30 AM
February 7, 2024 03:30 PM
February 2, 2024 02:00 PM