


There was more anticipation than usual for this month’s ISM Non-Manufacturing PMI. Why? As it’s much older brother, the ISM manufacturing PMI essentially rolled over and went into the fetal position.
Fears of a global slowdown were already weighing on sentiment ahead of ISM manufacturing sinking to a 10-year low, until the dire number finally saw equity markets roll over from their highs. As we outlined previously, the service sector has remained in growth since the last recession in 2009 whilst manufacturing had sent 2 false recession signals over the same period. Therefore, we’d prefer to see service PMI fall alongside manufacturing to better assess the likelihood of a US recession. And it appears the service sector is now closing the gap to the downside, although the numbers aren’t all that bad.
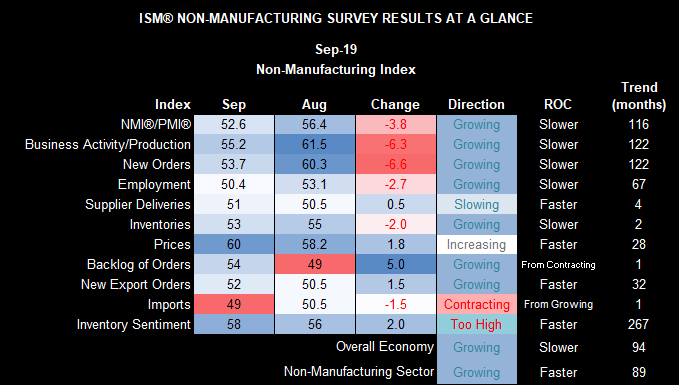
There are a few worrying signs within the service sector, although it remains expansive none the less.
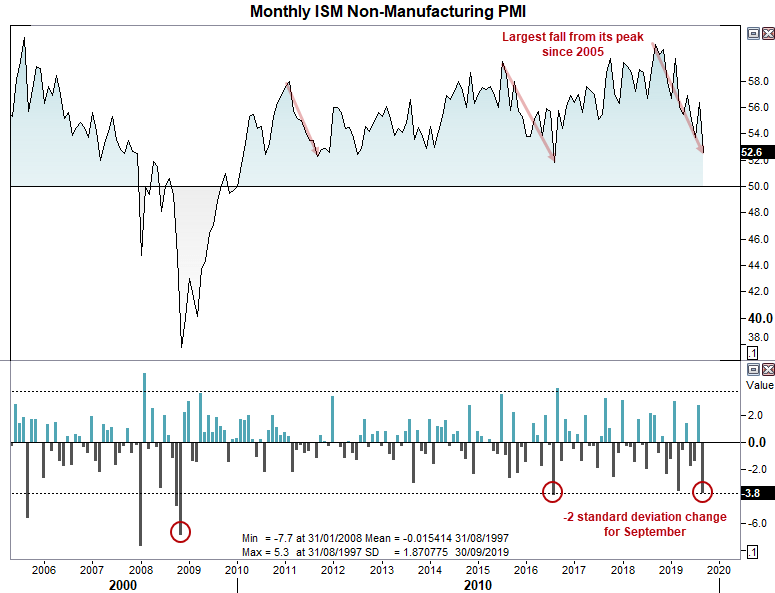
- The service sector is expanding at its slowest rate in 3 years, at 52.6
- Falling 8.2 from its peak, it’s the largest decline from its peak during the entire expansion. We’d have to 2007 to see a fall from its high of a greater magnitude.
- September was a -2 standard deviation change. Whist technically the industry remains in growth territory, it has had quite a knock to the head.
- Employment barely grew at 50.4 and is its slowest rate since 2013
- Imports contracted for the first time since February
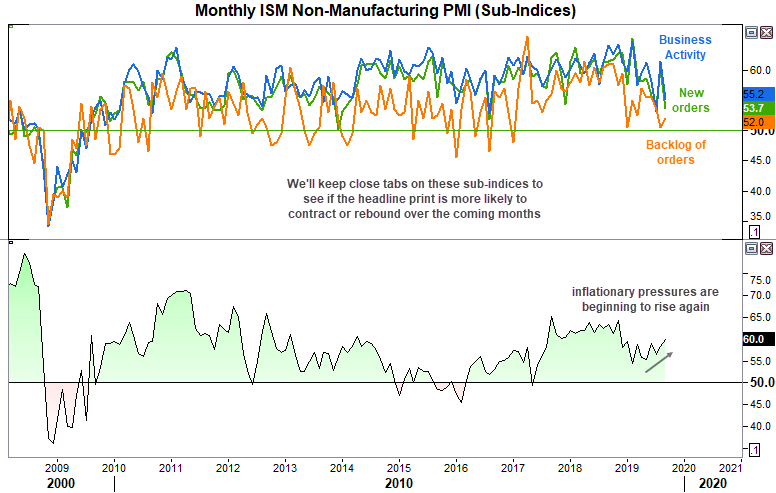
- New orders and business activity/production fell -6.6 and -6.3 points respectively in September. However, they remain elevated at 53.7 and 55.2 and the monthly changes are quite volatile
But it’s not all bad. And, unlike the manufacturing sector, there are some good numbers within the sub sectors:
- Prices are their highest in 10 months at 60 (inflationary)
- Only imports declined, and new orders and business production remain expansive.
- Backlog of orders sits just above its 1-year average at 54
Key takeaway: It may not have been a great month for services by historical standards, but with new orders, business production and backlog of orders remaining expansive, it leaves potential for a bounce. Particularly if US and China sign that famous trade deal. Sure, if we see this move into contraction then the probability of a US recession goes up, but we’d prefer to see if there are signs of weakness in new orders, production and backlog of orders next month before calling Armageddon for the financial markets.
Still, traders have increased the probability of a Fed rate cut this month to 86% from 77% the day before. We think it’s unlikely they’ll pull the trigger on a 50- bps cut simply because they’re easing from the lowest peak in history, and they’d prefer to leave such a move for if or when the markets are truly in turmoil.
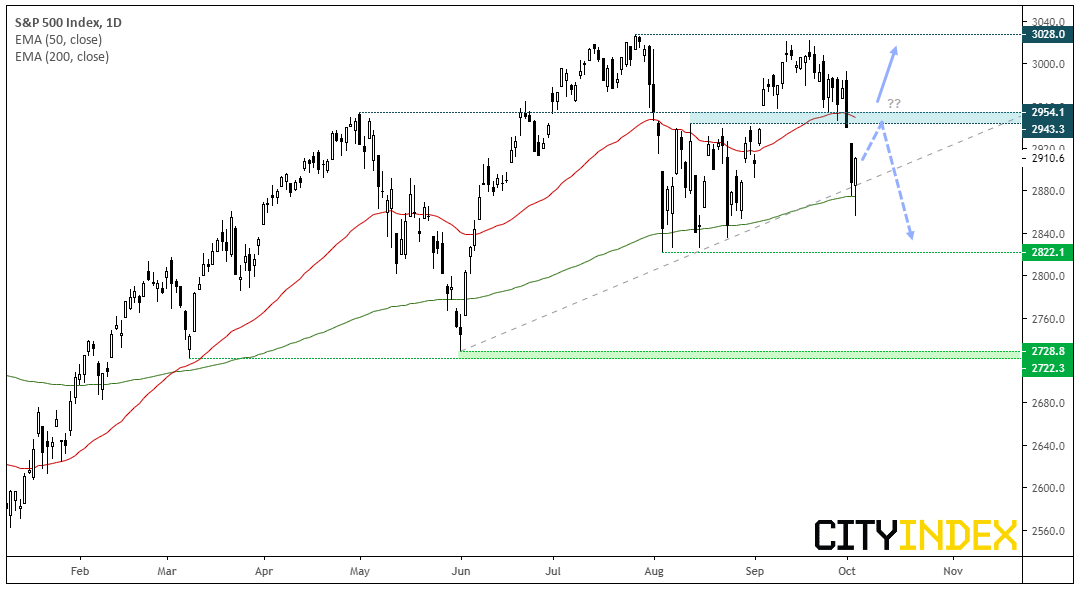
The S&P500 recovered as it headed into the end of the session and trades back above 2,900. An initial sell-off threatened a break of its June trendline, until the 200-day eMA saved the day. A 2-day reversal pattern in form of a bullish piercing line suggests the initial breakdown could have been a bear-trap but we also have the 50-day MA as a likely resistance level. Furthermore, yesterday’s bullish candle needs to be taken in context of the initial decline, so bulls may not yet be out of the woods just yet.
- Unless we see prices rebound sharply, bears could consider fading into low volatility moves below the 2,950 (prior support) or wait for a lower high to form beneath the key level.
- However, if we see a sharp rebound then bulls could assume the low is in and target the all-time highs once more.
- Higher expectations of a rate cut are supportive of stocks, so a weak Nonfarm payroll report could throw bulls another lifeline. Conversely, a strong employment report could cap gains.
Related analysis:
NFP Preview: Another Weak Report Could Cement a Fed Rate Cut This Month
NFP could be the Last Horse in the Trifecta
Manufacturing PMI Gets Even Uglier, But Is It The End Of The World? | DJT, FDX
Latest market news
Today 04:00 PM
Today 01:15 PM
Today 11:30 AM
Today 08:18 AM
Latest US articles
January 5, 2024 03:09 PM
January 4, 2024 06:55 PM
January 3, 2024 07:55 PM
January 2, 2024 08:00 PM