
It was another sea of red where the ISM manufacturing report was concerned. The S&P500 took notice.
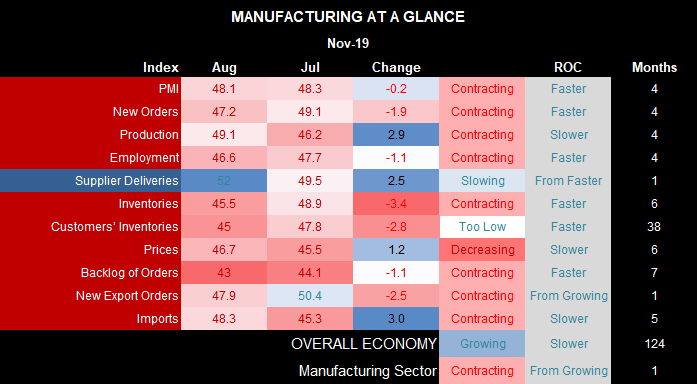
- Manufacturing PMI contracts for a fourth consecutive month.
- New orders and employment contracting back near post-GFC lows.
- Prices (manufacturing inflation) contracted at their fastest pace in two years.
- And basically, lots of contraction and weak numbers overall.
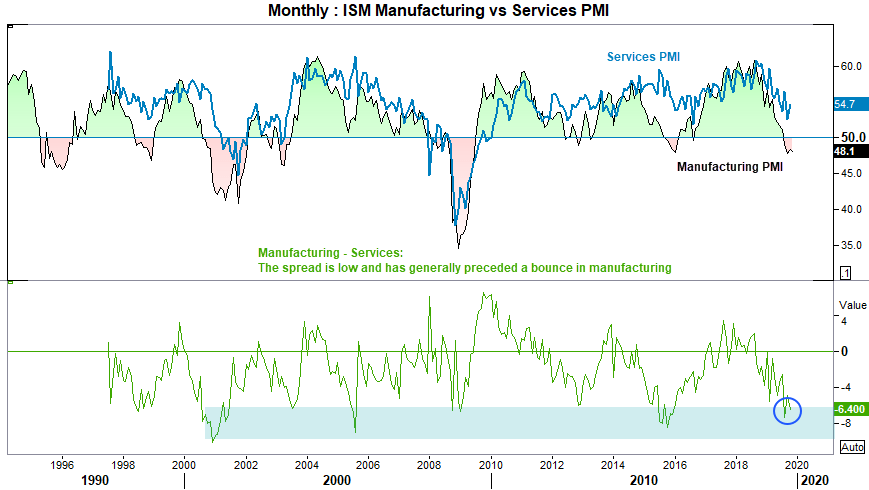
The market reaction said it all; USD/JPY fell from its highs, equities took a tumble and gold was bid whilst markets become concerted we could be headed for a recession. ISM manufacturing has been a closely watched report for decades, given its ability to lead growth and therefore, signal the potential for recession months in advance. Yet as previously highlighted, the US (and global) economy is increasingly shifting its focus over to the services sector. Moreover, the service sector continues to expand and it would have to drop quite sharply to close the gap with manufacturing and signal a broader, economic downturn. Whilst this doesn’t undermine the importance of manufacturing, we need to remain mindful that the US economy could be headed towards a manufacturing recession and not necessarily a full-blown one. Take note that ISM non-manufacturing read is out tomorrow.
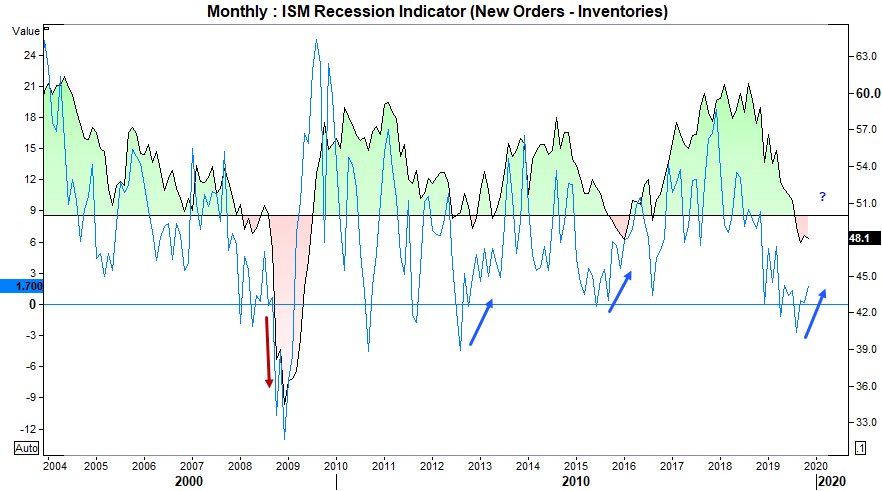
Is ISM manufacturing about to trough? Another metric we follow is the spready between manufacturing new orders – inventories. Dubbed the ISM recession indicator, the idea is we’d want to see both the headline PMI and spread in negative territory to improve the odds a recession is imminent. Yet we see new orders is outperforming inventories, which is keeping the spread above zero. Sure, it’s a messy indicator which sees the spread decline whilst ISM was elevated, or the ISM contract whilst the spread remain positive. Yet it does a god job of providing a ‘reality check’. Combine this, with the fact that ISM Non-manufacturing remains firmly in expansion territory, then perhaps the current decline in ISM manufacturing is noise and more likely to be another blip over a full-blown recession.
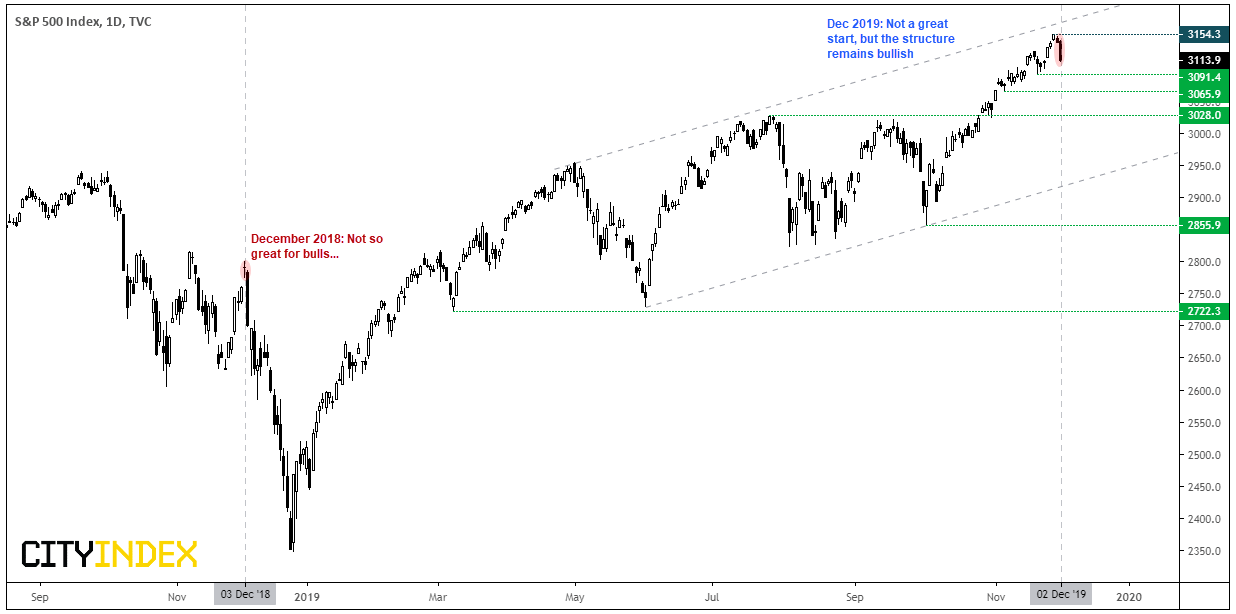
For once, the S&P500 took notice of some fundamental data and traded lower for the session, although Trump’s threat to restore steel and aluminum tariffs on Brazil and Argentina also played a part. However, given yesterday’s selloff was its most bearish close in 2 months, it begs the following question:
Will this December be as turbulent (and bearish) as December 2018? Last year, December opened with a Rikshaw man doji below resistance, before embarking upon a -16% slide over the next fourteen session. If a similar move were to unfold, the S&P500 could be trading around 2,640 by the 20th December. Whilst it recovered 6% into the close of the year, it was hardly the Santa’s rally many envisaged.
Perhaps it will be different this time… Over the long-term, December is traditionally a strong month for equities, and famously dubbed Santa’s rally. But we also find ourselves just off record highs and price action was extended beyond the upper Keltner band to warn of the need of a pullback. Whereas last year the market has already topped in September before oscillating in a volatile range, leading into December. Therefore, we can’t quite make a direct comparison based around December’s price action.
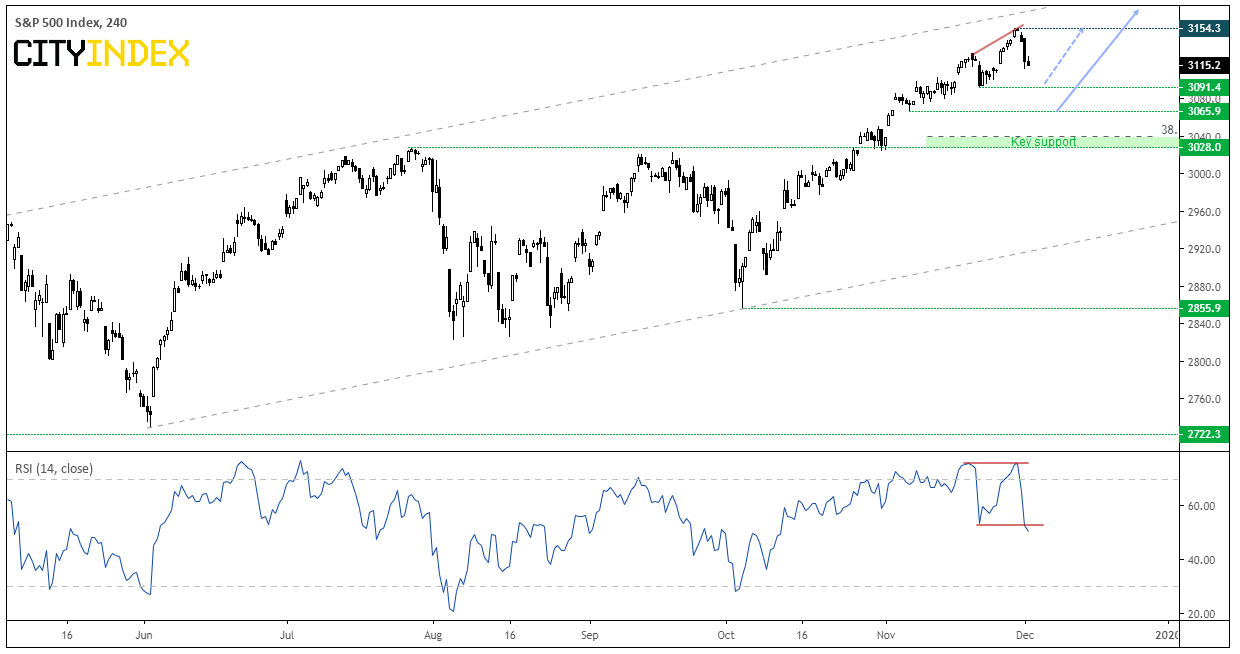
Still, it appears an interim top is in place.
- The index remains within a wide bullish channel which allows for a sizeable pullback, whilst also maintaining its bullish structure
- A bearish divergence has formed on the 4-hour RSI, and it also broke its swing low to warn of a deeper decline.
- Near-term bias remains bearish below 3154.3, with 3019.40 and 3065.90 making suitable targets.
- If downside momentum wanes and we build a new level of support around 3065.90 or even 3091.4, the risks are skewed to the upside and for ‘dip buyers’ to return.
- A break below 3028 (and if done with momentum) would point towards a far more-grizzly scenario. Until which, we’ll continue to look for evidence the correction could be over.
Related Analysis:
December Brings the Volatility!
ISM Services PMI: A Few Worrying Signs Yet With Some Positives Too | S&P500
The Closer You Look At ISM's PMI, The Uglier It Gets | EUR/USD, USD/CHF
Latest market news
Today 10:37 AM
Today 08:25 AM
Latest Wall Street articles

August 8, 2023 09:54 AM

July 26, 2022 03:39 AM
June 30, 2022 08:10 AM

June 22, 2022 02:56 AM