


June 22, 2021 5:19 PM
Is USD/JPY ready to break into near territory?
In early June 2015, USD/JPY hit a high of 125.86. Just about 1 year later, price had fallen to a low of 98.79! USD/JPY has been oscillating within that range since then, forming lower highs along the way. At the beginning of the pandemic in February and March 2020, USD/JPY tried to push above the downward sloping trendline from the highs but failed each time. That is, until March of this year. In March, USD/JPY finally closed above the trendline. Price pulled back to retest the trendline and the RSI moved from overbought conditions to neutral. Now, USD/JPY appears ready to bust higher above the March highs of 110.97.
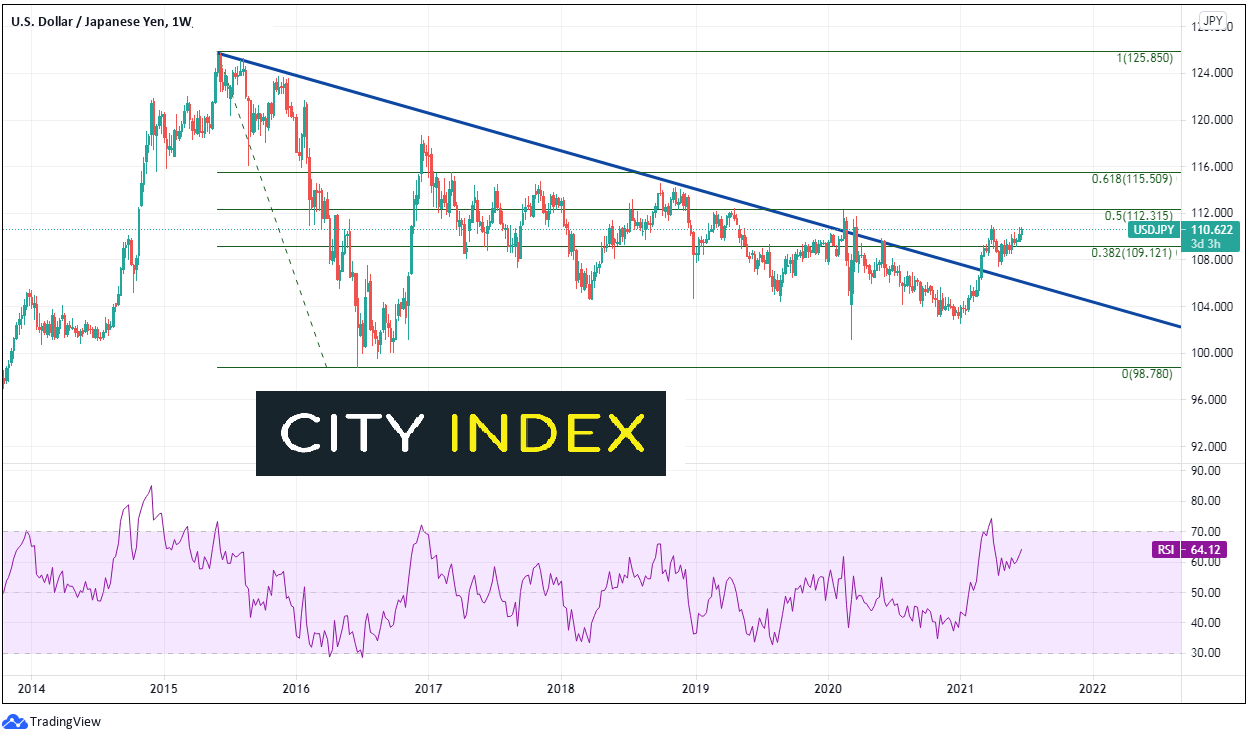
Source: Tradingview, City Index
On a daily timeframe, USD/JPY had continued moving lower since the pandemic highs and eventually narrowed towards the apex of a descending wedge (green). It then formed a low at 102.59 on January 6th (price failed to take out the spike low during the coronavirus volatility in March 2020). USD/JPY continued to move higher (along with the US Dollar Index) and broke above the long term weekly trendline (red). Price traded as high as 110.97 before correcting. Notice that the RSI had been overbought for 2 weeks before reaching those highs, an indication that USD/JPY may have been ready for a pullback.
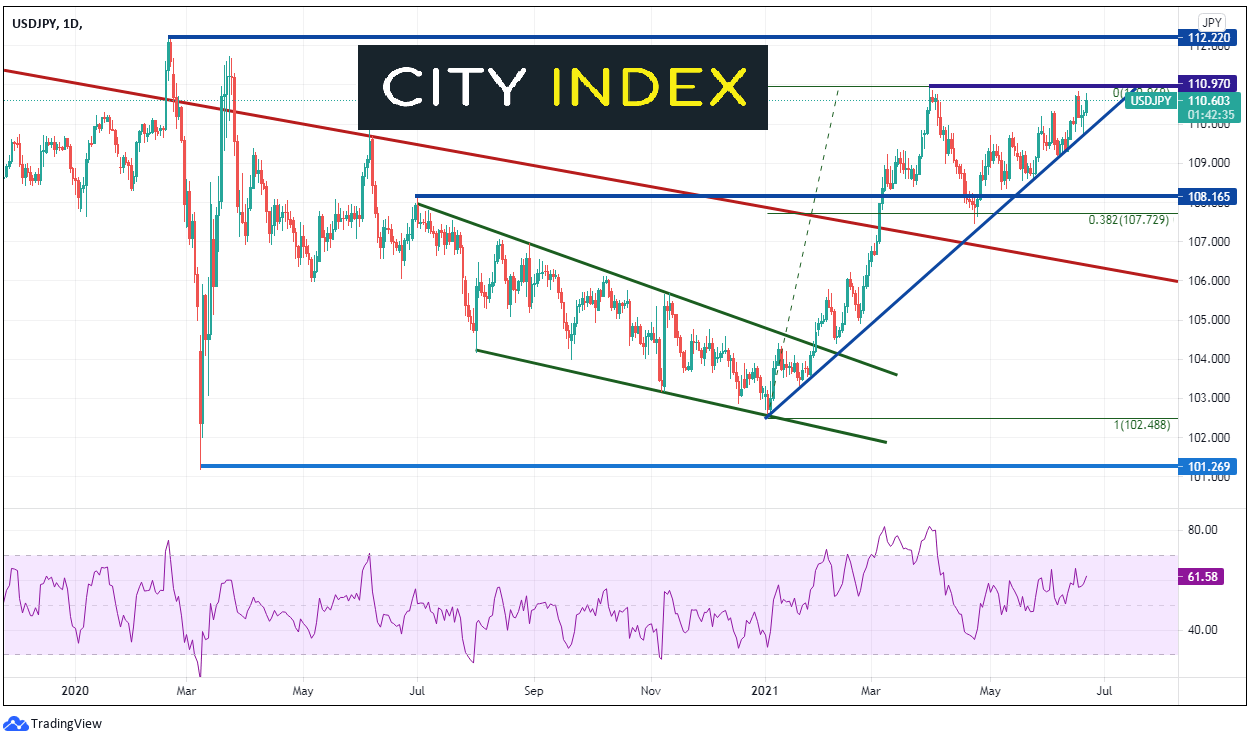
Source: Tradingview, City Index
USD/JPY then pulled back to the 38.2% Fibonacci retracement level from the January 6th lows to the March 31st highs, near 107.73, however failed to close below it. USD/JPY also remained above the long-term trendline from the weekly chart. Price has been drifting higher since and appears to be ready to take out the 110.97 level from late March!
Everything you should know about the Japanese Yen
On a 240-minute timeframe, USD/JPY has been moving higher along a trendline off the January 6th lows green line) and is testing the March 31st highs. If price moves above 110.97, the next resistance level isn’t until 112.22. which is the high from February 2020 (see daily). Support is below at the upward sloping trendline near 109.85. Below there, price can fall to horizontal support near 108.16, ahead of the April 23rd lows of 107.48.
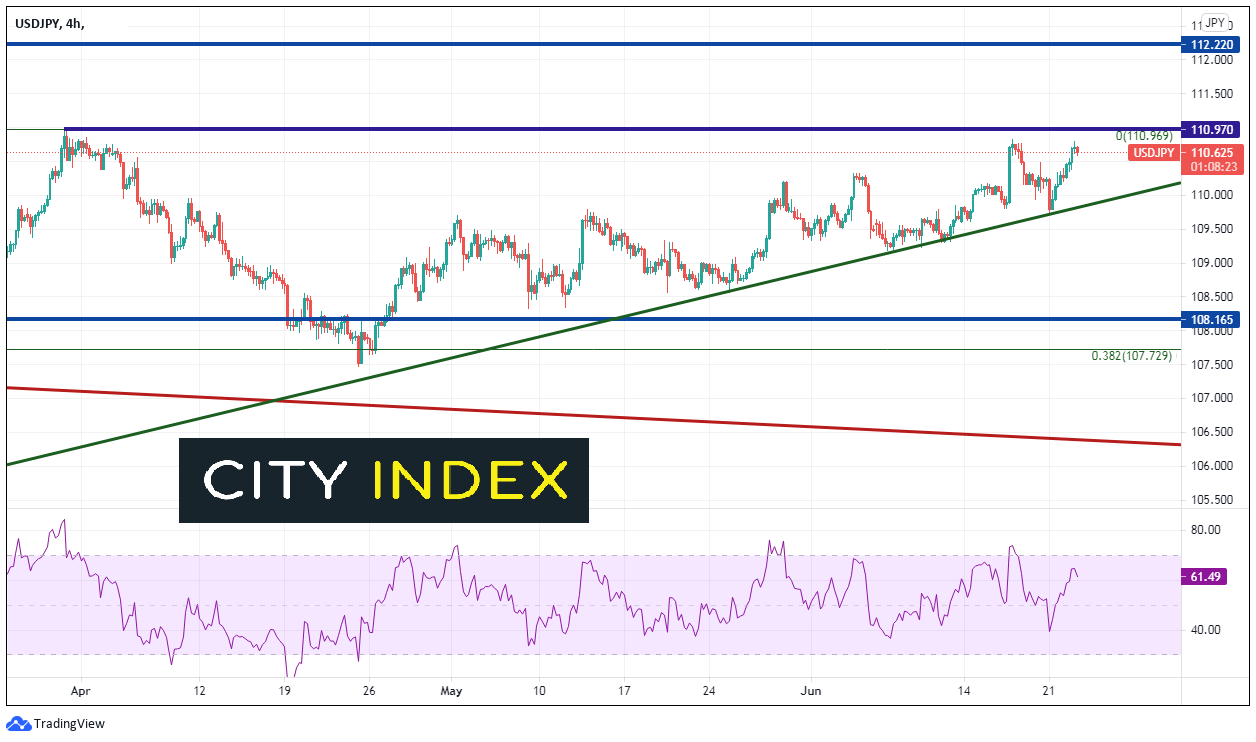
Source: Tradingview, City Index
Note that the BOJ meets on Friday. Revisions to forecasts are expected, however nothing market moving. Also continue to watch the parade of Fed speakers this week for clues as to when the Fed may announce tapering. As of the time of this writing, Fed Chairman Powell is speaking, however markets are not reacting to any of his comments.
Learn more about forex trading opportunities.
Latest market news
Yesterday 03:00 PM
Yesterday 01:12 PM
Yesterday 11:14 AM
Yesterday 08:28 AM
Latest Forex articles
April 24, 2024 03:14 PM
April 24, 2024 11:00 AM
April 23, 2024 11:09 PM